
Here at Flickr, we’re pretty nerdy. We like to measure stuff. We love measuring stuff. The more stuff we can measure, the better our understanding of how different parts of the website work with each other gets. There are two types of measurement we especially like to do – counting and timing. These exciting activities help us to know what is happening when things break – if a page is taking a long time to load, where is that time being spent and what task have we started to do more of.
Counting
Our best friend, when it comes to stats collection and display is RRDTool, the Round-Robin Database. RRD is a magical database that uses a fixed amount of space for storing stats over time. It does this by storing data in decreasingly lower resolution as time goes by, keeping high resolution per-minute data for the last few hours, a lower per-day resolution data for times last year (the resolution is actually configurable). Since you generally care less about detailed data in the past, this works really well. RRD typically works in two modes – you feed it a number every so often and that number can either be a gauge (such as the current temperature) or a counter (such as the number of packets sent through a switch port). Gauges are easy, but RRD is clever enough to know how counters change over time. It then lets you graph these data points in interesting ways.
The problem with RRD is that you often want to count some kind of event that doesn’t have a natural counter associated with it. For instance, we might want to count how many times we connect to a certain cache server from a particular piece of code, so that we can graph it. We know when we connect to it in the code, but there’s no global number tracking that count. We need some central counter which we increment each time we connect, which we can then periodically feed into RRD. This tends to get quickly further complicated by having multiple machines on which the code runs – every one of Flickr’s web servers will run this code, but we care about how many times they connect to the cache server in total.
The easiest way to do this is to use a database. When we connect to the cache server, connect to the database and increment a counter. Some other job can then periodically connect to the database, read the counter and store it in RRD. Simple! However, the operation of connecting to the database and performing the write does not have zero cost. It takes some amount of time which may appear trivial at first, but doing that several hundred times a second (lots of the operations we want to track happen very often), multiplied by hundreds of different things we want to track quickly adds up. It’s a little bit quantum theory-ish – the act of observing changes the observed reality. When we’re counting very fast operations, we can’t spend much time on the counting.
There’s luckily an operation which we can perform that’s cheap enough to do very often while allowing us to easily collect data from multiple servers at once: UDP. The User Datagram Protocol is TCP’s ugly kid brother. Unlike TCP, UDP does not guarantee delivery of packets, nor the order in which they’ll be received. In return, they’re a lot faster to send and use less bandwidth. When counting frequent stats, losing the odd packet doesn’t really hurt us, especially when we can also graph when we’ve been dropping packets (under Linux, try netstat -su and look for “packet receive errors”). Changing the UDP buffer size (kernel variable net.core.rmem_max) allows you to queue more packets before processing them, if you find you can’t keep up.
In our client code, this is very easy to do. Every language has a different approach (of course!), but they’re all straight forward.
Perl
	my $sock = new IO::Socket::INET(
			PeerAddr	=> $server,
			PeerPort	=> $port,
			Proto		=> 'udp',
		) or die('Could not connect: $!');

	print $sock "$valuen";

	close $sock;
PHP
	$fp = fsockopen("udp://$server", $port, $errno, $errstr);
	if ($fp){
		fwrite($fp, "$valuen");
		fclose($fp);
	}
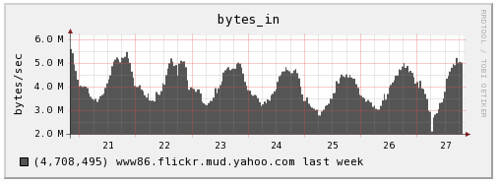
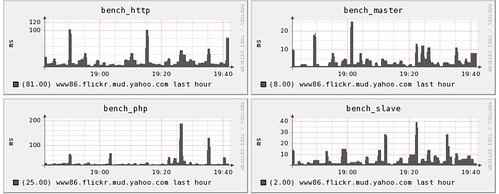
The trickier part is the server component. We need something that will receive packets, increment counters and periodically save the counter to RRD files. At Flickr we developed a small Perl daemon to do this, using an alarm to save the counters to RRD. The UDP packet simply contains the name of the counter to increment. We can then start to track interesting operations over time:
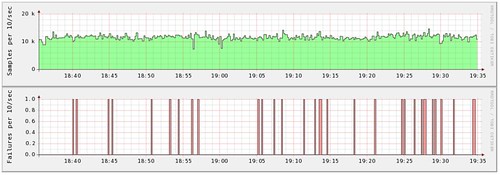
The next stage was to change our simple counters into ones which recorded state. We’re performing a certain operation 300 times a second, but how often is it failing? RRD allows you to store multiple counters in a single file and then graph them together in a variety of ways, so all we needed was a little modification to our collection daemon.
The red area on the left shows some failures. Some tasks have very few relative failures, but which are still important to see. That’s easy enough, but just producing two graphs with different Y-axis scales (something that RRD does auto-magically for us).
Timing
Counting the number of times we perform a certain task can tell us a lot, but often we’ll want to know how long that task took. The simplest way to do this is to perform a task periodically and graph the result. This is pretty simple and something that we use Ganglia for to good effect.
The problem with this is that it just tells us the time it took to perform our single test task. This is useful for looking at macro problems, but is useless against tasks that can take a variable amount of time. If a database server is processing one in ten tasks slowly, then that will appear on this graph as a spike (roughly) every ten samples – it’s impossible for us to tell the different between a server that processes 10% of requests slowly and a sever that has periodic slow periods. We could take an average time (but storing an accumulator along with the counter, and dividing at the end of each period) and this gets us closer to useful data.
What we really need to know, however, is something like our standard deviation – both what our average is and where the bulk of our samples lie. This allows us to distinguish between a request that always takes 20ms and one that takes 10ms half of the time and 30ms half of the time. To achieve this, we changed our collection daemon to keep a list of timings. At the end of each sampling period (somewhere between 10s and 60s, depending on the thing we’re monitoring), we then sort these times, find the mean and the first and third quartiles. By storing each of these values (along with a min and max) into RRD every period, we can show the average timing along with the tolerance.
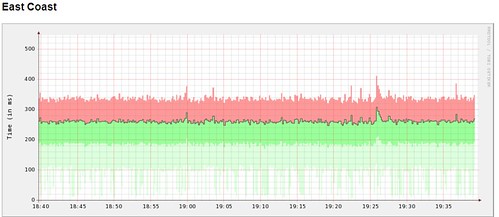
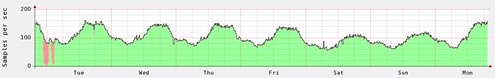
So our task takes 250ms on average, with 75% finishing within ~340ms and 25% finishing within ~190ms. The light green shaded area shows the lowest 25%. We don’t shade the upmost 25%, since random spikes can cause the Y-axis to become to large that it makes the graph difficult to read. We don’t have this problem with the lowest quartile, since nothing can be faster than zero (and we always show zero on the Y-axis to avoid scale bias).
Bringing it all together
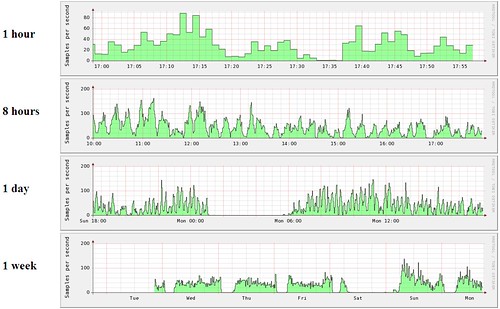
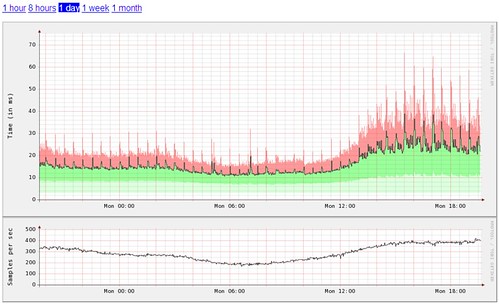
The next step is to tie together the counting with the timing, to allow us to see how the rate of an operation effected the time which it took to perform. By simply lining up graphs below each other, we can easily see relationships between these different measures:
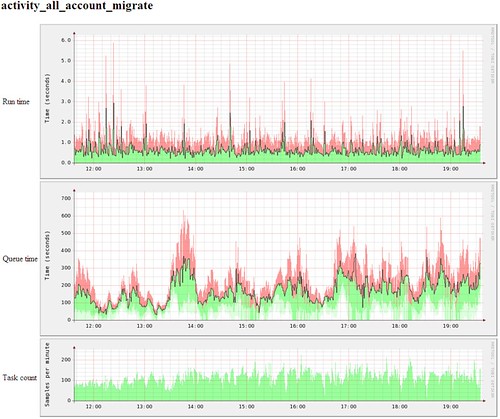
Of course, we like to go a little measurement-crazy, so we tend to sample as many things as we can to look for patterns. This graph from our Offline Task System shows how often we run a particular task, how long it took to execute but also how long it was queued before we ran it.
The code for out timing daemon is available in the Flickr Code repository and through our trac install, so you can have a play with it yourself. It just requires RRDTool and some patience. Get graphing!