We saved you a step…

It seems when we launched version 2.0 of our Flickr shapes, we posted them with a flaw which made them useless to most popular geo applications.

Awwwww…

Luckily, Christopher Manning wrote a python script which makes them useful.

Yaaaayyyyy!

The least we can do is post an update which has already been christopher-manning-ified, So, we are very happy to announce version 2.0.1 of the Flickr shape files which can be downloaded here:
http://www.flickr.com/services/shapefiles/2.0.1/

Look, it works:


Flickr Shapes 2.0.1 in TileMill

A very hearty THANKS! from your friends at Flickr, Christopher.

The great map update of 2012

Today we are announcing an update to the map tiles which we use site wide. A very high majority of the globe will be represented by Nokia’s clever looking tiles.

Nokia map tile

We are not stopping there. As some of you may know, Flickr has been using Open Street Maps (OSM) data to make map tiles for some places. We started with Beijing and the list has grown to twenty one additional places:

Mogadishu
Cairo
Algiers
Kiev
Tokyo
Tehran
Hanoi
Ho Chi Minh City
Manila
Davao
Cebu
Baghdad
Kabul
Accra
Hispaniola
Havana
Kinshasa
Harare
Nairobi
Buenos aires
Santiago

It has been a while since we last updated our OSM tiles. Since 2009, the OSM community has advanced quite a bit in the tools they provide and data quality. I went into a little detail about this in a talk I gave last year.

Introducing Pandonia

Nokia map tile

Today we are launching Buenos Aires and Santiago in a new style. We will be launching more cities in this new style in the near future. They are built from more recent OSM data and they will also have an entirely new style which we call Pandonia. Our new style was designed in TileMill from the osm-bright template, both created by the rad team at MapBox. TileMill changes the game when it comes to styling map tiles. The interface is developed to let you quickly iterate style changes to tiles and see the changes immediately. Ross Harmes will be writing a more detailed account of the work he did to create the Pandonia style. We appreciate the tips and guidance from Eric Gunderson, Tom MacWright, and the rest of the team at MapBox

We are looking forward to updating all of our OSM places with the Pandonia style in the near future and growing to more places after that… Antarctica? Null Island? The Moon? Stay tuned and see…

Changing our Javascript API

To host all of these new tiles we needed to find a flexible javascript api. Cloudmade’s Leaflet is a simple and open source tile serving javascript library. The events and methods map well to our previous JS API, which made upgrading simple for us. All of our existing map interfaces will stay the same with the addition of modern map tiles. They will also support touch screen devices better than ever. Leaflet’s layers mechanism will make it easier for us to blend different tile sources together seamlessly. We have a fork on GitHub which we plan to contribute to as time goes on. We’ll keep you posted.

In the privacy of our homes

The best thing about working at Flickr is that my coworkers all love the site and product ideas can come from anyone.

Recently, the Flickr staff had to work from home while our office was disassembled and relocated a few floors down. A chance to sleep in and start the weekend early? Or get together with a few ambitious coworkers and hack together a new feature?

We met at Nolan’s house, ate a farmer’s breakfast, and brainstormed.

Flickr Satellite Office

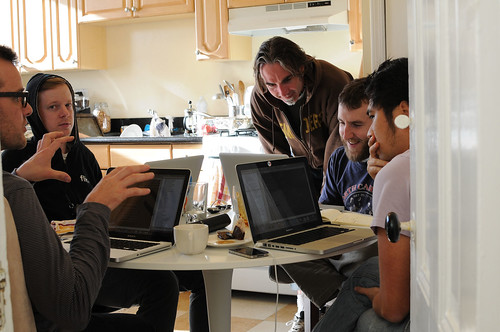
We wanted to build something fun, which a few of us could start working on that morning and have a demo ready by the end of the day. Something suited to the talents and interests of the people in the room. Secret Faves? Risqué Explore?

Bert wanted to help people geotag more photos, but he wanted more sophisticated privacy controls first. I’d been using a simple web app that I built with the Flickr API to manage the geo privacy of my photos, and it seemed like something more people should have access to.

So we had a need. We had a proof of concept. We had enough highly caffeinated engineers to fill a small dinner table. “Let’s build geofences.”

What the beep is a geofence?

Parked outside a school! by Dunstan

You probably know what geotagging is. It’s nerd-speak for putting your photos on a map. Flickr pioneered geotagging about five years ago, and our members have geotagged around 300 million photos and videos.

We’ve always offered the same privacy settings for location data that we offer for commenting, tagging, and who can see your photos. You have default settings for your account, which are applied to all new uploads, and which you can override on a photo-by-photo basis.

This works well for most metadata. I have a few photos that I don’t want people to comment on or add notes to, but for the most part, one setting fits all my needs.

But geo is special. I often override my default geo privacy. Every time I upload a photo taken at my house, I mark it “Contacts only”. Same for my grandma’s house. And that dark place with the goats and candles? Sorry, it’s private.

Managing geo privacy by hand is tedious and error prone. Geofences make it easier.

geofences

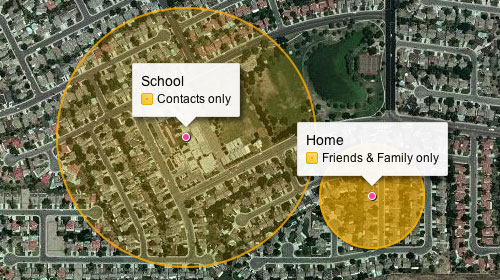
Geofences are special locations that deserve their own geo privacy settings. Simply draw a circle on a map, choose a geo privacy setting for that area, and you’re done. Existing photos in that location are updated with your new setting, and any time you geotag a photo in that area, it gets that setting too.

Geofences are applied at upload time, or when you geotag a photo after uploading it. It doesn’t matter how you upload or tag your photos: The Organizr, the map on your photo page, and the API all use geofences.

If you’re ready to dive in, visit your account geo privacy page and make your first geofence.

Boring details

When dealing with privacy, we need to be conservative, reliable, and have clearly defined rules. The geofences concept is simple, but the edge cases can be confusing.

no geofences, common use case
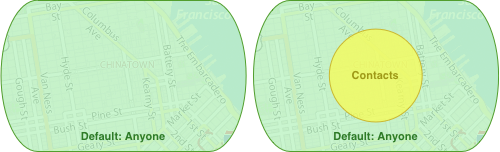
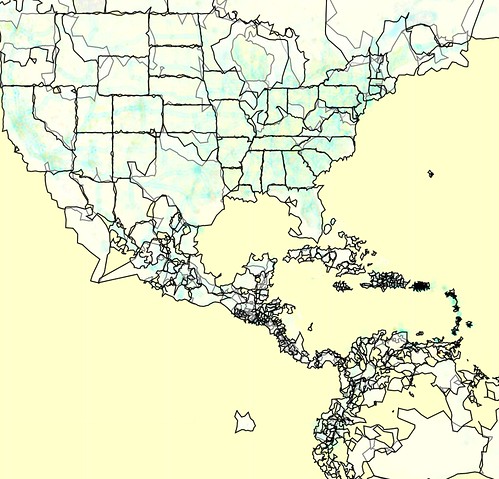
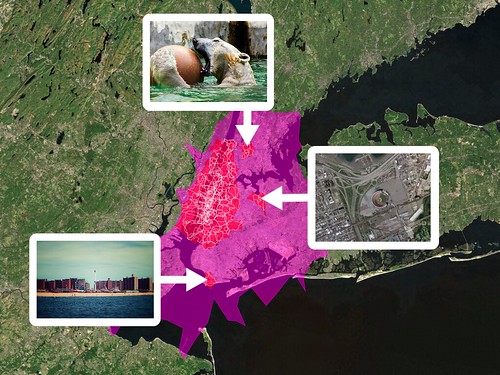
No geofencesCommon use case

  • What happens when you have overlapping geofences?
  • What if you move a photo from outside a geofence to inside one?
  • Where does your default geo privacy setting fit in?

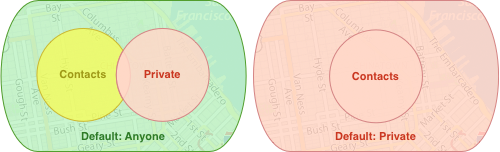
The vast majority of Flickr members will never encounter these edge cases. But when they do, Flickr plays it safe and chooses the most private setting from the following options:

  • The member’s default geo privacy
  • The current geo privacy of the photo (if it was already geotagged)
  • Any geofences for the new location

If your account default is more private than your geofences, the geofences won’t take effect. If you have overlapping geofences for a point, the most private one will take effect. If you move a photo whose location was private into a contacts-only geofence, it will stay private.

overlapping geofences, more private account default
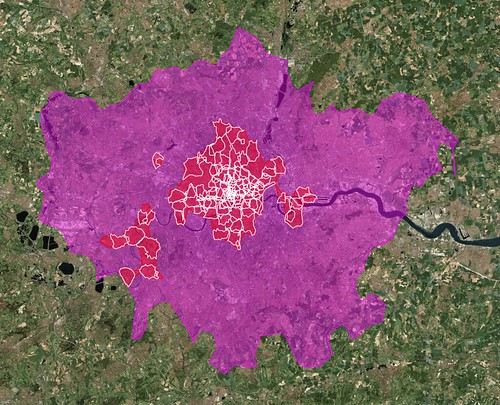
Overlapping geofencesMore private account default

As a reminder, here’s the ranking of our privacy settings:

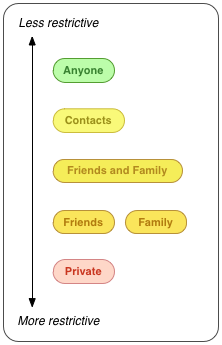
Note that friends and family are at the same level in the hierarchy. Your family shouldn’t see locations marked as friends only, and vice versa.

With that in mind, what should Flickr do when someone geotags a photo where friends and family overlap? Maybe he wants both friends and family to see it, or maybe he wants neither friends nor family to see it. To really be safe, we must make that location completely private.

friends and family overlap
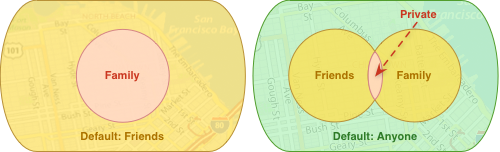
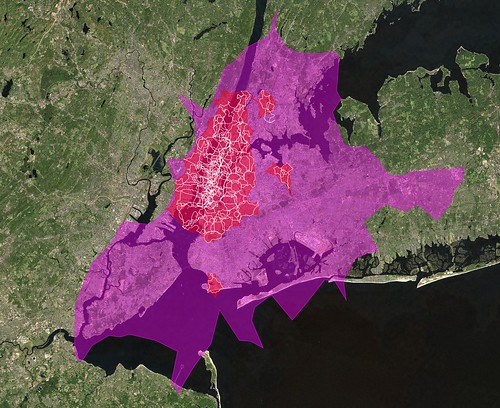
Friends and family overlap

Go forth and geotag

A few years ago, privacy controls like this would have been overkill. Geo data was new and underused, and the answer to privacy concerns was often, “you upload it, you deal with it.”

But today, physical places are important to how we use the web. Sometimes you want everyone to know exactly where you took a photo. And sometimes you don’t.

Flickr Shapefiles Public Dataset 2.0

An embarrassingly long time ago we released the first public version of the Flickr Shapefiles. What does this have to do with Captain America and a cat? Nothing, really.

Anyway, we haven’t completely forgotten about shapefiles and have finally gotten around to generating a new batch (read about Alpha Shapes to find out how it’s done). When Aaron did the first run we had somewhere around ninety million (90M) geotagged photos. Today we have over one hundred and ninety million (190M) and that number is growing rapidly. Of course lots of those will fall within the boundaries of the existing shapes and won’t give us any new information, but some of them will improve the boundaries of old shapes, and others will help create new shapes where there weren’t any before. Version 1 of the dataset had shapes for around one hundred and eighty thousand (180K) WOE IDs, and now we have shapes for roughly two hundred and seventy thousand (270K) WOE IDs. Woo.

The dataset is available for download today, available for use under the Creative Commons Zero Waiver:

http://www.flickr.com/services/shapefiles/2.0/

Little Johnny JSON

Today I'm a Cop.

Originally we provided the full dataset in our own home-grown XML format because, well, it seemed like a good idea. For version two we’re releasing the shapes in GeoJSON format. We think this is a Good Thing because unlike our  old XML format, at least one other person in the world already knows how to read and write GeoJSON. For example, Our friends over at Stamen Design and SimpleGeo have created a ridiculously easy-to-use JavaScript library called Polymaps which of course reads GeoJSON out of the box. With a few lines of JavaScript you can render the Flickr shapefiles and start using them without all that pesky XML parsing stuff:

Statez

Or if GeoJSON doesn’t suit you you can use a free tool like ogr2ogr to convert it to something that does.

Layers

1000 layers

(photo by doug88888)

The GeoJSON format allows grouping of features (and their related geometries) into FeatureCollection objects. A FeatureCollection seems to be roughly equivalent to a layer in a typical GIS, or a placetype in WhereOnEarth-speak. To make the dataset a little easier to manage we decided to break the shapes up into FeatureCollections based on placetype; one each for continents, countries, regions (states), counties, localities (cities), and neighbourhoods. Each of these is its own GeoJSON file in the dataset.

Here’s an example of what one of our GeoJSON objects looks like:

{
  "type": "FeatureCollection",
  "name": "Flickr Shapes Public Dataset 2.0 - Regions",
  "features": [
    {
      "type": "Feature",
      "id": 2344541,
      "properties": {
      "woe_id": 2344541,
      "place_id": "Cxf0SmObApi9R9T8",
      "place_type": "region",
      "place_type_id": 8,
      "label": "Barbuda, AG, Antigua and Barbuda",
    },
    "geometry":
    {
      "type": "MultiPolygon",
      "created": 1292444482,
      "alpha": 0.03,
      "points": 118,
      "edges": 17,
      "is_donuthole": 0,
      "link": {
        "href": "http://farm6.static.flickr.com/5209/shapefiles/2344541_20101215_724c4cae47.tar.gz",
      },
      "bbox": [-62.314453125,17.086019515991,-61.690979003906,17.93692779541],
      "coordinates": [
        [
          [[-61.739044,17.587740], [-61.735268,17.546171], [-61.690979,17.426649], [-61.765137,17.413546]
... etc

A file is a single FeatureCollection object which holds an array of Features, which each hold a Geometry which is a MultiPolygon, which holds an array of Polygons which in turn each consist of an array of LinearRings. Got it?

You’ve Been Superseded

We’ve also included a separate file/layer called flickr_shapes_superseded.geojson. This is a FeatureCollection that consists of all the WOE IDs that have been “superseded”. Occasionally (too often?) a WOE ID needs to be retired and replaced with a new one. We keep up to date with these and are always reverse-geocoding against the latest WOE IDs. However, there are plenty of old photos (and Flickr shapes) that have been assigned to one of these old IDs, and we have shapes for them (currently a little more than nine thousand). A simple solution might be to just re-assign these photos to the new WOE IDs (when a WOE ID is retired its replacement is specified), or even just re-run the reverse-geocoding process. This may not be what the owner of the photo wants; it might come out with a different result than they had at first (which they may have been perfectly happy with), if the size and location of the WOE rectangle changed (which it probably did). So it’s a problem without a clear solution. And since we have data for these old WOE IDs we’ve included their associated shapes in the dataset. In most cases there will be shapes corresponding to the new WOE IDs that will over time become more and more accurate as more photos get uploaded and end up being assigned to the new WOE IDs. But you can have the old ones too.

WTF

Sometimes, Clustr just gets it wrong. As mentioned in previous posts many of the Flickr shapes are just plain weird. It may be due to a lack of data (i.e. source photos), a weakness of the algorithm, an inappropriate choice of the alpha parameter or (shame!) a plain old bug. One of the things that surprised us was that Clustr was not supposed to output inner rings, or polygons with holes. It turns out that it does. In the GeoJSON output this can cause some weirdness (depending on what you use to render the shapes) since the GeoJSON is formatted with the assumption that each ring is a distinct polygon, instead of possibly one part of a single polygon with holes in it. This and other weirdness are known issues and something we shall strive to fix in the future, however we felt it best to release the existing dataset now rather than spend forever trying to get it perfect, and end up not releasing anything at all.

You may also notice that unlike version 1 of the dataset, there is only a single shape per WOE ID. All of the previous versions of the shapes are still available via the Flickr API, but in the interests of keeping the file size down we’ve limited this download to just the latest versions of each shape.

And as always, there’s lots more to do.

In case you wanted to bake us a cake ….

Ian Sanchez has proposed a new geo data “test for freeness” in the spirit of the Debian project’s tests for free software.

A set of geodata, or a map, is libre only if somebody can give you a cake with that map on top, as a present. – Ian Sanchez

I mention this because the Flickr Shapefiles can be used unencumbered as a cake decoration. And we like cake. We like photos of cake as well. But we prefer cake.

“That’s maybe a bit too dorky, even for us.”

Around the time we added support for Open Plaques machine tags Frankie Roberto, the project lead, asked: “What about supporting Open Street Map (OSM) way machine tags?”

My immediate response was something along the lines of “That’s maybe a bit too dorky, even for us.” Which meant that I kept thinking about it. And now we’re doing it.

If you’re not sure way what a “way” is, it’s best to start with OpenStreetMap’s own description of how their metadata is structured:

Our maps are made up of only a few simple elements, namely nodes, ways and relations. Each element may have an arbitrary number of properties (a.k.a. Tags) which are Key-Value pairs (e.g. highway=primary) …

A node is the basic element of the OSM scheme. Nodes consist of latitude and longitude (a single geospacial point) …

A way is an ordered interconnection of at least 2 and at most 2000 nodes that describe a linear feature such as a street, or similar. Should you reach the node limit simply split your way and group all ways in a relation if necessary. Nodes can be members of multiple ways.

Frankie’s interest is principally in marking up buildings in and around Manchester, where he lives. When he tags one of his photos with osm:way=30089216 we can fetch the metadata (the key-value pairs) for that way using the OSM API and see that it has the following properties:

<osm version="0.6" generator="OpenStreetMap server">
	<way id="30089216" visible="true" timestamp="2009-07-04T12:02:47Z" version="2" changeset="1728727" user="Frankie Roberto" uid="515">
		<nd ref="331415447"/>
		<nd ref="331415448"/>
		<nd ref="331415449"/>
		<nd ref="331415450"/>
		<nd ref="331415447"/>
		<tag k="architect" v="Woodhouse, Corbett & Dean"/>
		<tag k="building" v="yes"/>
		<tag k="created_by" v="Potlatch 0.10f"/>
		<tag k="name" v="St George's House"/>
		<tag k="old_name" v="YMCA"/>
		<tag k="start_date" v="1911"/>
	</way>
</osm>	

That allows to us “expand” the original machine tag and display a short caption next to the photo, in this case: “St George’s House is a building in OpenStreetMap” with a link back to the web page for that way on the OSM site.

The technical terms for this process is “Adding the machine tags extra love“.

You may have noticed that there are a bunch of other key-value pairs in that example, like the name of the architect, that we don’t do anything with. Which attributes are we looking for, then? The short answer is: Not most of them. The complete list of map features in OSM is a bit daunting in scope and constantly changing. It would be nice to imagine that we could keep pace with the discussions and the churn but that’s just not going to happen. If nothing else, the translations alone would become unmanageable.

Instead we’re going to start small and see where it takes us. Here are the list of tagged features in a way or node definition that we pay attention to, and how they’ll be displayed:

  • k=name v={NAME}
    … is a feature in OpenStreetMap (If present, with another recognized tag we will display the name for the thing being described in place of the more generic “this is a…”)

  • k=building v=yes
    … is a building in OpenStreetMap

  • k=historic
    … is an historic site in OpenStreetMap

  • k=cycleway
    … is a bicycle path in OpenStreetMap

  • k=motorway (v=cycleway)
    … is a highway in OpenStreetMap (unless v is “cycleway” in which case it’s a bike path)

  • k=railway v=subway (or tram or monorail or light_rail)
    … is a subway (or tram or monorail or light_rail) line in OpenStreetMap

  • k=railway v=station
    … is a train station in OpenStreetMap; if the type of railway is also defined (above) then we’ll be specific about the type of station. I should mention that as of this writing we’re still waiting for the translations for “this is a train station” to come back because I, uh… anyway, real soon now.

  • k=waterway v=stream (or canal or river)
    … this is a stream (or canal or river) in OpenStreetMap

  • k=landuse v=farm (or forest)
    … this is a farm (or forest) in OpenStreetMap

  • k=natural v=forest (or beach)
    … this is a forest (or beach) in OpenStreetMap

Which means: We’ve almost certainly got at least some of it wrong. Anyone familiar with OSM features will probably be wondering why we haven’t included amentiy or shop tags since they contain a wealth of useful information. I hope we will, but it wasn’t clear how we should decide which features to support (more importantly, which to exclude) and the number of possible combinations were starting to get a bit out of hand and we have this little photo-sharing site to keep running.

This is the part where I casually mention that we’ve also added machine tags extra love for Four Square venues IDs. I’m just saying…

The features we’re starting with may seem a bit odd, with a heavy focus on natural land features (and train stations). Some of this is a by-product of the work we’ve been pursuing with the alpha shapes and “donut holes”, derived from geotagged photos, and some of it is just trying to shine the spotlight on places and environments that we take for granted.

Like I said, we’ve almost certainly got at least some of it wrong but hopefully we got part of it right and can correct the rest as we go. This one is definitely a bit more of an experiment than some of the others.

Finally, in the tangentially related department we finished wiring up the RSS/syndication feeds to work properly with wildcard machine tags. That means you can subscribe to a feed of all the (public) photos tagged with osm:way= or osm:node= or, if you’re like me, all the photos of places to eat in Dopplr with dopplr:eat=.

Enjoy!

horse=yes

a map Jason Bourne could eat cake on

Yes, I got a bit emotional at the third OpenStreetMap conference, held in the CCC, Amsterdam last weekend — mainly because this globe we are on is the only one we know — we really are mapping our universe, doing it our way. Creating the world we want to live in. I thought it worth while to say “Thanks” to some people. Being British, the feeling of being a bit foolish stopped me from being too effusive!

Tim Waters

A couple weeks ago I had the pleasure of attending, and the privilege of speaking at, the State of the Map conference in Amsterdam. I told the story of how we came to use Open Street Maps (OSM), how it works on the backend and talked a little bit about what we’d like to do next: Moving beyond “bags of tiles”, a better way to keep up to date with changes to the OSM database and, for good measure, a little bit of tree-hugging at the end.

Most of all, though, I wanted to take the opportunity to thank the OSM community. To thank them for making Flickr, the thing that we care about and work on all day, better. To thank them for proving the nay-sayers wrong.

To say that OSM started with an audacious plan (to map the entire world by “hand” one neighbourhood and one person at a time) would be an understatement. You would have been forgiven, at the time, for laughing.

And yet, in a few short years they are well on their way having nurtured both a community of users and an infrastructure of tools that makes it hard to ever imagine a world without Open Street Maps. In the U.K. alone, as Muki Haklay demonstrated, they have produced a free and open dataset whose coverage and fidelity rivals those created by the Ordinance Survey with its government funding and 250-year head start.

That is really exciting both because of the opportunities that such a rich and comprehensive dataset provide but also because it proves what is possible. The Internets are still a pretty great place that way.

mugs

photo by russelldavies

There were too many excellent talks to list them all, but here’s a short (ish) list that betrays some of my interests and biases:

  • Harry Wood’s talk on tagging in OSM. I actually missed this talk and after seeing the slides I am doubly disappointed. Open Street Map is not just the raw geographic data that people collect but also all the metadata that is used to describe it. OSM uses a simple tagging system for recording “map features” and Harry’s talk on managing the chaos, navigating the disputes and juggling the possibilities looked like it was really interesting.

    (The title of this post is, in fact, a gentle poke at the black sheep of the OSM tagging world. There really are map features tagged “horse=yes” which is mostly hilarious until you remember how much has been accomplished with a framework that allows for tags like that.)

  • The Sunday afternoon maps-and-history love-fest that included Frankie Roberto’s “Mapping History on Open Street Map“, Tim Water’s “Open Historical Maps” and the Dutch Nationaal Archief’s presenting “MapIt 1418“, a project to allow users to add suggested locations for their photos in the Flickr Commons!

    Tim’s been doing work for The New York Public Library, another Flickr Commons member, and MapWarper (the code that powers the NYPL’s historical map rectifier) is an open source project and available on GitHub.

  • Mikel Maron’s “Free and Open Palestine” (the slides are here but you should really watch the video) which is an amazing story of collecting map data in the West Bank and Gaza.

    Mikel was also instrumental in creating a scholarship program to pay the travel and lodging expenses for 15 members from the OSM community, from all over the world, to attend the conference. Because he’s kind of awesome, that way.

But that’s just me. I’d encourage you to spend some time poking around all the other presentations that are available online:

Despite the “bag of tiles” approach for using OSM on Flickr getting a bit old it still works so as of right here, right now:

We’ve also refreshed the tiles for Beijing and Tehran where, I’m told, the OSM community has added twice as much data since we first started showing (OSM) maps a month ago!

If it sometimes seems like we’re doing all of this in a bit of an ad hoc fashion that’s because we (mostly) are. How and when and where are all details we need to work out going forward but, in the meantime, we have map tiles where there were none before so it can’t be all bad.

Finally, because the actual decision to attend the conference was so last minute I did not get the memo to all presenters to include a funny picture of SteveC (one of the original founders of Open Street Maps) in their slides.

To make up for that omission, I leave you now with the one-and-only Steve Coast.

Steve *loves* Yahoo

photo by Andy Hume

Every Step A Story

Many of you will have already read on the sister Flickr.com blog that we added “nearby” pages to the m.flickr.com site, last week, for phones that support the W3C Geolocation API (that means the iPhone, or Gears if you’ve got an Android phone).

Ross summed it up nicely, writing:

Use this to explore your neighborhood, or find the best places to photograph local landmarks from. Reload the page as you walk around a city, and see the things that have happened there in the past. You’ll see a place through the eyes of the flickrverse.

We’ve also updated the nearby pages on the main site so that when you go to…

www.flickr.com/nearby

…without a trailing latitude and longitude, we’ll see if you have any one of a variety of browser plugins that can tell us your location. This is similar to the Find My Location button on the site maps, that Dan described back in April, but for nearby!

Like the iPhone’s Mobile Safari browser, the next version of Firefox (version 3.5, currently being tested as a release candidate) will also support automagic geolocation so you won’t even need to install any plugins or other widgets.

Just point your browser to www.flickr.com/nearby/ and away you go.

The other piece of nearby-related news is Tom Taylor’s fantastic FireEagle application for the Mac called Clarke.

Clarke is a toolbar app that sits quietly in the background and scans the available wireless networks using the Skyhook APIs to triangulate your position and updates FireEagle with your current location.

In addition to being an excellent FireEagle client, Clarke also supports Nearby-iness for a variety of services, including Flickr.

I’m writing this post from FlickrHQ, in downtown San Francisco, so when I choose Flickr from Clarke’s Nearby menu it loads the following page in my web browser:

http://www.flickr.com/nearby/37.794116,-122.402776

Which is kind of awesome! It means that you can travel to a brand new place, open up your laptop and just like magic (read: once you’ve connected to a wireless network) see pictures nearby.

Woosh!

Flickr Shapefiles Public Dataset 1.0

Yes, it is.

photo by dp

The name sort of says it all, really, but here’s the short version:

We are releasing all of the Flickr shapefiles as a single download, available for use under the Creative Commons Zero Waiver. That’s fancy-talk for “public domain”.

The long version is:

To the extent possible under law, Flickr has waived all copyright and related or neighboring rights to the “Flickr Shapefiles Public Dataset, Version 1.0”. This work is published from the United States. While you are under no obligation to do so, wherever possible it would be extra-super-duper-awesome if you would attribute flickr.com when using the dataset. Thanks!

We are doing this for a few reasons.

  • We want people (developers, researchers and anyone else who wants to play) to find new and interesting ways to use the shapefiles and we recognize that, in many cases, this means having access to the entire dataset.
  • We want people to feel both comfortable and confident using this data in their projects and so we opted for a public domain license so no one would have to spend their time wondering about the issue of licensing. We also think the work that the Creative Commons crew is doing is valuable and important and so we chose to release the shapefiles under the CC0 waiver as a show of support.
  • We want people to create their own shapefiles and to share them so that other people (including us!) can find interesting ways to use them. We’re pretty sure there’s something to this “shapefile stuff” even if we can’t always put our finger on it so if publishing the dataset will encourage others to do the same then we’re happy to do so.
buster tries to solve our TV problems

photo by mbkepp

The dataset itself is pretty straightforward. It is a single 549MB XML file uncompressed (84MB when zipped). The data model is a simple, pared-down version of what you can already get via the Flickr API with an emphasis on the shape data.

Everything lives under a single root places element. For example:

<place woe_id="26" place_id="BvYpo7abBw" place_type="locality" place_type_id="7" label="Arvida, Quebec, Canada">
	<shape created="1226804891" alpha="0.00015" points="45" edges="15" is_donuthole="0">
		<polylines bbox="48.399932861328,-71.214576721191,48.444801330566,-71.157333374023">
			<polyline>
				<!-- points go here-->
			</polyline>
		</polylines>
		<shapefile url="http://farm4.static.flickr.com/3203/shapefiles/26_20081116_082a565562.tar.gz" />
	</shape>
	
	<!-- and so on -->
</place>	
			

Aside from the quirkiness of the shapes themselves, it is worth remembering that some of them may just be wrong. We work pretty hard to prevent Undue Wronginess ™ from occurring but we’ve seen it happen in the past and so it would be, well, wrong not to acknowledge the possibility. On the other hand we don’t think we would have gotten this far if it wasn’t mostly right but if you see something that looks weird, please let us know

The dataset is available for download, today, from:

http://www.flickr.com/services/shapefiles/1.0/

The other exciting piece of news is that the Yahoo! GeoPlanet team has also released a public dataset of all their WOE IDs that include parent IDs, adjacent IDs and aliases (that’s just more fancy-talk for “different names for the same place”) under the Creative Commons Attribution License.

Which is pretty awesome, really.

Now & Then

They’ve also released the GeoPlanet Placemaker API. You feed it a big old chunk of free-form text and then “the service identifies places mentioned in text, disambiguates those places, and returns unique identifiers (WOEIDs) for each, as well as information about how many times the place was found in the text, and where in the text it was found.”

Again, Moar Awesome.

And a bit dorky. It’s true. The data, all by itself, won’t tell a story. It needs people and history to make that possible but as you poke around all this stuff don’t forget the value of having a big giant, and now open, database of unique identifiers and what is possible when you use them as a bridge between other things. Without WOE IDs we wouldn’t have been able to generate the shapefiles or do the Places project or provide a way to search for photos by place, rather than location.

Enjoy!

Oh, and those “unidentified” outliers, in New York City, that I mentioned in the last post about the donut hole shapefiles: The Bronx Zoo, Coney Island and Shea Stadium. Of course!

(if you lived here)

photos by ajagendorf25, auggie tolosa and the sky

The Absence and the Anchor

Back in January, I wrote a blog post about some experimental work that I’d been doing with the shapefile data we derive from geotagged photos. I was investigating the idea of generating shapefiles for a given location using not the photos associated with that place but, instead, from the photos associated with the children of that place. For example, London:

London

The larger pink shape is what we (Flickr) think of as the “city” of London. The smaller white shapes are its neighbourhoods. The red shapes represent an entirely new shapefile that we created by collecting all the points for those neighbourhoods and running them through Clustr, the tool we use to generate shapes.

For lack of any better name I called these shapes “donut holes” because, well, because that’s what they look like. The larger shape is a pretty accurate reflection of the greater metropolitain area of London, the place that has grown and evolved over the years out of the city center that most people would recognize in the smaller red shape. Our goal with the shapefiles has always been to use them to better reverse-geocode people’s geotagged photos so these sorts of variations on a theme can better help us understand where a place is.

Like New York City. No one gets New York right including us try as we might (though, in fairness, it’s gotten better recently (no, really)) and even I am hard pressed to explain the giant pink blob, below, that is supposed to be New York City. On the other hand, the red donut hole shape even though (perhaps, because) it spills in to New Jersey a bit is actually a pretty good reflection of the way people move through the city as a whole.

NYC

It could play New York on TV, I think.

I’m not sure how to explain the outliers yet, either, other than to say the shapefiles for city-derived donut holes may contain up to 3 polygons (or “records” in proper Shapefile-speak) compared to a single polygon for plain-old city shapes so if nothing else it’s an indicator of where people are taking photos.

If the shapefiles themselves are uncharted territory, the donut holes are the fuzzy horizon even further off in the distance. We’re not really sure where this will take us but we’re pretty sure there’s something to it all so we’re eager to share it with people and see what they can make of it too.

Vietnam

(This is probably still my favourite shapefile ever.)

Starting today, the donut hole shapes are available for developers to use with their developer magic via the Flickr API.

At the moment we are only rendering donut hole shapefiles for cities and countries. I suppose it might make sense to do the same for continents but we probably won’t render states (or provinces) simply because there is too much empty unphotographed space between the cities to make it very interesting.

There are also relatively few donut holes compared to the corpus of all the available shapefiles so rather than create an entirely new API method we’ve included them in the flickr.places.getShapeHistory API method which returns all the shapefiles ever created for a place. Each shape element now contains an is_donuthole attribute. Here’s what it looks like for London:

<shapes total="6" woe_id="44418" place_id=".2P4je.dBZgMyQ"
	place_type="locality" place_type_id="7">

	<shape created="1241477118" alpha="9.765625E-05" count_points="275464"
		count_edges="333" is_donuthole="1">

		<!-- shape data goes here... -->

	</shape>

	<!-- and so on ->

</shapes>

Meanwhile, the places.getInfo API method has been updated to included a has_donuthole attribute, to help people decide whether it’s worth calling the getShapeHistory method or not. Again, using London as the example:


<place place_id=".2P4je.dBZgMyQ" woeid="44418" latitude="51.506"
       longitude="-0.127" place_url="/United+Kingdom/England/London"
       place_type="locality" place_type_id="7" timezone="Europe/London"
       name="London, England, United Kingdom" has_shapedata="1">

	<shapedata created="1239037710" alpha="0.00029296875" count_points="406594"
                   count_edges="231" has_donuthole="1" is_donuthole="0">

        <!-- and so on -->
</place>

Finally, here’s another picture by Shannon Rankin mostly just because I like her work so much. Enjoy!