At Flickr, we understand that the value in our image corpus is only unlocked when our members can find photos and photographers that inspire them, so we strive to enable the discovery and appreciation of new photos.
To further that effort, today we are introducing similarity search on Flickr. If you hover over a photo on a search result page, you will reveal a “…” button that exposes a menu that gives you the option to search for photos similar to the photo you are currently viewing.
In many ways, photo search is very different from traditional web or text search. First, the goal of web search is usually to satisfy a particular information need, while with photo search the goal is often one of discovery; as such, it should be delightful as well as functional. We have taken this to heart throughout Flickr. For instance, our color search feature, which allows filtering by color scheme, and our style filters, which allow filtering by styles such as “minimalist” or “patterns,” encourage exploration. Second, in traditional web search, the goal is usually to match documents to a set of keywords in the query. That is, the query is in the same modality—text—as the documents being searched. Photo search usually matches across modalities: text to image. Text querying is a necessary feature of a photo search engine, but, as the saying goes, a picture is worth a thousand words. And beyond saving people the effort of so much typing, many visual concepts genuinely defy accurate description. Now, we’re giving our community a way to easily explore those visual concepts with the “…” button, a feature we call the similarity pivot.

The similarity pivot is a significant addition to the Flickr experience because it offers our community an entirely new way to explore and discover the billions of incredible photos and millions of incredible photographers on Flickr. It allows people to look for images of a particular style, it gives people a view into universal behaviors, and even when it “messes up,” it can force people to look at the unexpected commonalities and oddities of our visual world with a fresh perspective.
What is “similarity”?
To understand how an experience like this is powered, we first need to understand what we mean by “similarity.” There are many ways photos can be similar to one another. Consider some examples.
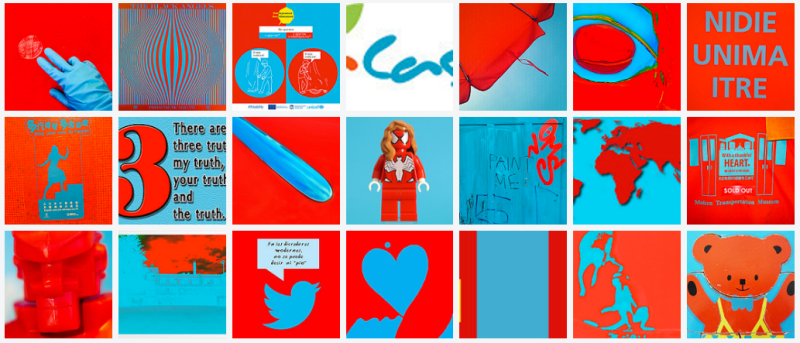
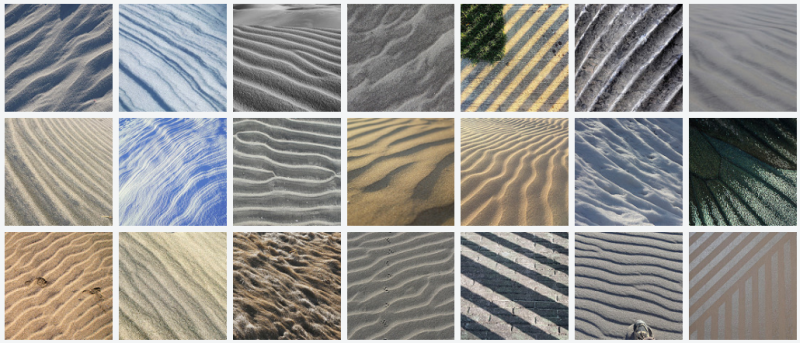
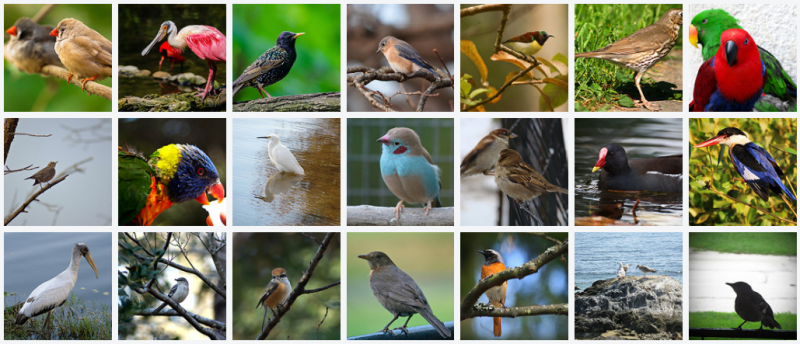
It is apparent that all of these groups of photos illustrate some notion of “similarity,” but each is different. Roughly, they are: similarity of color, similarity of texture, and similarity of semantic category. And there are many others that you might imagine as well.
What notion of similarity is best suited for a site like Flickr? Ideally, we’d like to be able to capture multiple types of similarity, but we decided early on that semantic similarity—similarity based on the semantic content of the photos—was vital to facilitate discovery on Flickr. This requires a deep understanding of image content for which we employ deep neural networks.
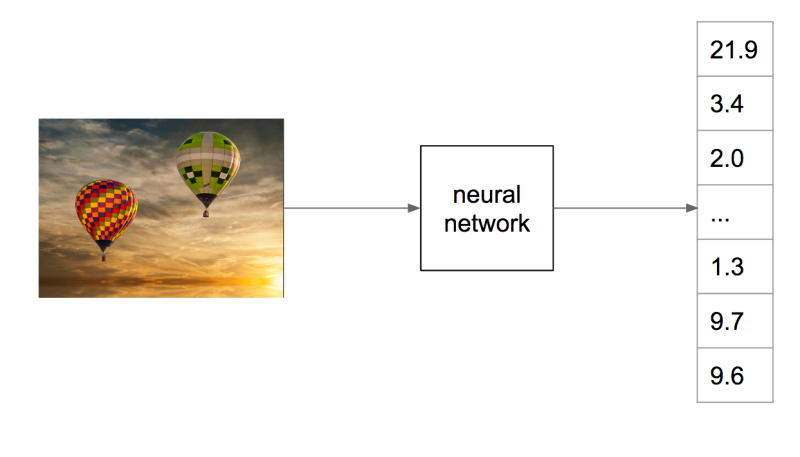
We have been using deep neural networks at Flickr for a while for various tasks such as object recognition, NSFW prediction, and even prediction of aesthetic quality. For these tasks, we train a neural network to map the raw pixels of a photo into a set of relevant tags, as illustrated below.

Internally, the neural network accomplishes this mapping incrementally by applying a series of transformations to the image, which can be thought of as a vector of numbers corresponding to the pixel intensities. Each transformation in the series produces another vector, which is in turn the input to the next transformation, until finally we have a vector that we specifically constrain to be a list of probabilities for each class we are trying to recognize in the image. To be able to go from raw pixels to a semantic label like “hot air balloon,” the network discards lots of information about the image, including information about appearance, such as the color of the balloon, its relative position in the sky, etc. Instead, we can extract an internal vector in the network before the final output.
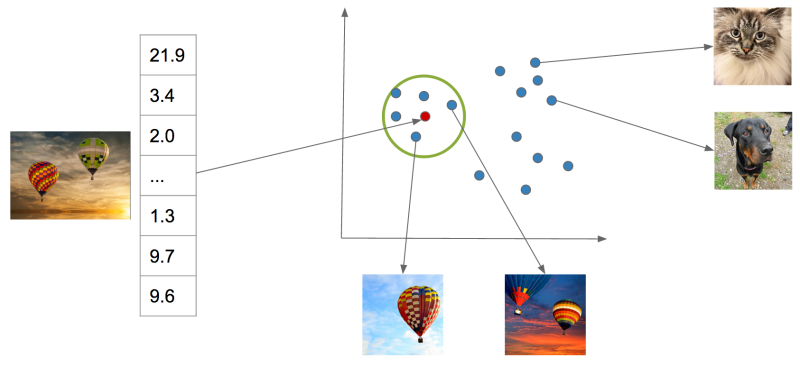
For common neural network architectures, this vector—which we call a “feature vector”—has many hundreds or thousands of dimensions. We can’t necessarily say with certainty that any one of these dimensions means something in particular as we could at the final network output, whose dimensions correspond to tag probabilities. But these vectors have an important property: when you compute the Euclidean distance between these vectors, images containing similar content will tend to have feature vectors closer together than images containing dissimilar content. You can think of this as a way that the network has learned to organize information present in the image so that it can output the required class prediction. This is exactly what we are looking for: Euclidian distance in this high-dimensional feature space is a measure of semantic similarity. The graphic below illustrates this idea: points in the neighborhood around the query image are semantically similar to the query image, whereas points in neighborhoods further away are not.
This measure of similarity is not perfect and cannot capture all possible notions of similarity—it will be constrained by the particular task the network was trained to perform, i.e., scene recognition. However, it is effective for our purposes, and, importantly, it contains information beyond merely the semantic content of the image, such as appearance, composition, and texture. Most importantly, it gives us a simple algorithm for finding visually similar photos: compute the distance in the feature space of a query image to each index image and return the images with lowest distance. Of course, there is much more work to do to make this idea work for billions of images.
Large-scale approximate nearest neighbor search
With an index as large as Flickr’s, computing distances exhaustively for each query is intractable. Additionally, storing a high-dimensional floating point feature vector for each of billions of images takes a large amount of disk space and poses even more difficulty if these features need to be in memory for fast ranking. To solve these two issues, we adopt a state-of-the-art approximate nearest neighbor algorithm called Locally Optimized Product Quantization (LOPQ).
To understand LOPQ, it is useful to first look at a simple strategy. Rather than ranking all vectors in the index, we can first filter a set of good candidates and only do expensive distance computations on them. For example, we can use an algorithm like k-means to cluster our index vectors, find the cluster to which each vector is assigned, and index the corresponding cluster id for each vector. At query time, we find the cluster that the query vector is assigned to and fetch the items that belong to the same cluster from the index. We can even expand this set if we like by fetching items from the next nearest cluster.
This idea will take us far, but not far enough for a billions-scale index. For example, with 1 billion photos, we need 1 million clusters so that each cluster contains an average of 1000 photos. At query time, we will have to compute the distance from the query to each of these 1 million cluster centroids in order to find the nearest clusters. This is quite a lot. We can do better, however, if we instead split our vectors in half by dimension and cluster each half separately. In this scheme, each vector will be assigned to a pair of cluster ids, one for each half of the vector. If we choose k = 1000 to cluster both halves, we have k2= 1000 * 1000 = 1e6 possible pairs. In other words, by clustering each half separately and assigning each item a pair of cluster ids, we can get the same granularity of partitioning (1 million clusters total) with only 2 * 1000 distance computations with half the number of dimensions for a total computational savings of 1000x. Conversely, for the same computational cost, we gain a factor of k more partitions of the data space, providing a much finer-grained index.
This idea of splitting vectors into subvectors and clustering each split separately is called product quantization. When we use this idea to index a dataset it is called the inverted multi-index, and it forms the basis for fast candidate retrieval in our similarity index. Typically the distribution of points over the clusters in a multi-index will be unbalanced as compared to a standard k-means index, but this unbalance is a fair trade for the much higher resolution partitioning that it buys us. In fact, a multi-index will only be balanced across clusters if the two halves of the vectors are perfectly statistically independent. This is not the case in most real world data, but some heuristic preprocessing—like PCA-ing and permuting the dimensions so that the cumulative per-dimension variance is approximately balanced between the halves—helps in many cases. And just like the simple k-means index, there is a fast algorithm for finding a ranked list of clusters to a query if we need to expand the candidate set.
After we have a set of candidates, we must rank them. We could store the full vector in the index and use it to compute the distance for each candidate item, but this would incur a large memory overhead (for example, 256 dimensional vectors of 4 byte floats would require 1Tb for 1 billion photos) as well as a computational overhead. LOPQ solves these issues by performing another product quantization, this time on the residuals of the data. The residual of a point is the difference vector between the point and its closest cluster centroid. Given a residual vector and the cluster indexes along with the corresponding centroids, we have enough information to reproduce the original vector exactly. Instead of storing the residuals, LOPQ product quantizes the residuals, usually with a higher number of splits, and stores only the cluster indexes in the index. For example, if we split the vector into 8 splits and each split is clustered with 256 centroids, we can store the compressed vector with only 8 bytes regardless of the number of dimensions to start (though certainly a higher number of dimensions will result in higher approximation error). With this lossy representation we can produce a reconstruction of a vector from the 8 byte codes: we simply take each quantization code, look up the corresponding centroid, and concatenate these 8 centroids together to produce a reconstruction. Likewise, we can approximate the distance from the query to an index vector by computing the distance between the query and the reconstruction. We can do this computation quickly for many candidate points by computing the squared difference of each split of the query to all of the centroids for that split. After computing this table, we can compute the squared difference for an index point by looking up the precomputed squared difference for each of the 8 indexes and summing them together to get the total squared difference. This caching trick allows us to quickly rank many candidates without resorting to distance computations in the original vector space.
LOPQ adds one final detail: for each cluster in the multi-index, LOPQ fits a local rotation to the residuals of the points that fall in that cluster. This rotation is simply a PCA that aligns the major directions of variation in the data to the axes followed by a permutation to heuristically balance the variance across the splits of the product quantization. Note that this is the exact preprocessing step that is usually performed at the top-level multi-index. It tends to make the approximate distance computations more accurate by mitigating errors introduced by assuming that each split of the vector in the production quantization is statistically independent from other splits. Additionally, since a rotation is fit for each cluster, they serve to fit the local data distribution better.
Below is a diagram from the LOPQ paper that illustrates the core ideas of LOPQ. K-means (a) is very effective at allocating cluster centroids, illustrated as red points, that target the distribution of the data, but it has other drawbacks at scale as discussed earlier. In the 2d example shown, we can imagine product quantizing the space with 2 splits, each with 1 dimension. Product Quantization (b) clusters each dimension independently and cluster centroids are specified by pairs of cluster indexes, one for each split. This is effectively a grid over the space. Since the splits are treated as if they were statistically independent, we will, unfortunately, get many clusters that are “wasted” by not targeting the data distribution. We can improve on this situation by rotating the data such that the main dimensions of variation are axis-aligned. This version, called Optimized Product Quantization (c), does a better job of making sure each centroid is useful. LOPQ (d) extends this idea by first coarsely clustering the data and then doing a separate instance of OPQ for each cluster, allowing highly targeted centroids while still reaping the benefits of product quantization in terms of scalability.

LOPQ is state-of-the-art for quantization methods, and you can find more information about the algorithm, as well as benchmarks, here. Additionally, we provide an open-source implementation in Python and Spark which you can apply to your own datasets. The algorithm produces a set of cluster indexes that can be queried efficiently in an inverted index, as described. We have also explored use cases that use these indexes as a hash for fast deduplication of images and large-scale clustering. These extended use cases are studied here.
Conclusion
We have described our system for large-scale visual similarity search at Flickr. Techniques for producing high-quality vector representations for images with deep learning are constantly improving, enabling new ways to search and explore large multimedia collections. These techniques are being applied in other domains as well to, for example, produce vector representations for text, video, and even molecules. Large-scale approximate nearest neighbor search has importance and potential application in these domains as well as many others. Though these techniques are in their infancy, we hope similarity search provides a useful new way to appreciate the amazing collection of images at Flickr and surface photos of interest that may have previously gone undiscovered. We are excited about the future of this technology at Flickr and beyond.
Acknowledgements
Yannis Kalantidis, Huy Nguyen, Stacey Svetlichnaya, Arel Cordero. Special thanks to the rest of the Computer Vision and Machine Learning team and the Vespa search team who manages Yahoo’s internal search engine.