Flickr Shapefiles Public Dataset 1.0

Yes, it is.

photo by dp

The name sort of says it all, really, but here’s the short version:

We are releasing all of the Flickr shapefiles as a single download, available for use under the Creative Commons Zero Waiver. That’s fancy-talk for “public domain”.

The long version is:

To the extent possible under law, Flickr has waived all copyright and related or neighboring rights to the “Flickr Shapefiles Public Dataset, Version 1.0”. This work is published from the United States. While you are under no obligation to do so, wherever possible it would be extra-super-duper-awesome if you would attribute flickr.com when using the dataset. Thanks!

We are doing this for a few reasons.

  • We want people (developers, researchers and anyone else who wants to play) to find new and interesting ways to use the shapefiles and we recognize that, in many cases, this means having access to the entire dataset.
  • We want people to feel both comfortable and confident using this data in their projects and so we opted for a public domain license so no one would have to spend their time wondering about the issue of licensing. We also think the work that the Creative Commons crew is doing is valuable and important and so we chose to release the shapefiles under the CC0 waiver as a show of support.
  • We want people to create their own shapefiles and to share them so that other people (including us!) can find interesting ways to use them. We’re pretty sure there’s something to this “shapefile stuff” even if we can’t always put our finger on it so if publishing the dataset will encourage others to do the same then we’re happy to do so.
buster tries to solve our TV problems

photo by mbkepp

The dataset itself is pretty straightforward. It is a single 549MB XML file uncompressed (84MB when zipped). The data model is a simple, pared-down version of what you can already get via the Flickr API with an emphasis on the shape data.

Everything lives under a single root places element. For example:

<place woe_id="26" place_id="BvYpo7abBw" place_type="locality" place_type_id="7" label="Arvida, Quebec, Canada">
	<shape created="1226804891" alpha="0.00015" points="45" edges="15" is_donuthole="0">
		<polylines bbox="48.399932861328,-71.214576721191,48.444801330566,-71.157333374023">
			<polyline>
				<!-- points go here-->
			</polyline>
		</polylines>
		<shapefile url="http://farm4.static.flickr.com/3203/shapefiles/26_20081116_082a565562.tar.gz" />
	</shape>
	
	<!-- and so on -->
</place>	
			

Aside from the quirkiness of the shapes themselves, it is worth remembering that some of them may just be wrong. We work pretty hard to prevent Undue Wronginess ™ from occurring but we’ve seen it happen in the past and so it would be, well, wrong not to acknowledge the possibility. On the other hand we don’t think we would have gotten this far if it wasn’t mostly right but if you see something that looks weird, please let us know

The dataset is available for download, today, from:

http://www.flickr.com/services/shapefiles/1.0/

The other exciting piece of news is that the Yahoo! GeoPlanet team has also released a public dataset of all their WOE IDs that include parent IDs, adjacent IDs and aliases (that’s just more fancy-talk for “different names for the same place”) under the Creative Commons Attribution License.

Which is pretty awesome, really.

Now & Then

They’ve also released the GeoPlanet Placemaker API. You feed it a big old chunk of free-form text and then “the service identifies places mentioned in text, disambiguates those places, and returns unique identifiers (WOEIDs) for each, as well as information about how many times the place was found in the text, and where in the text it was found.”

Again, Moar Awesome.

And a bit dorky. It’s true. The data, all by itself, won’t tell a story. It needs people and history to make that possible but as you poke around all this stuff don’t forget the value of having a big giant, and now open, database of unique identifiers and what is possible when you use them as a bridge between other things. Without WOE IDs we wouldn’t have been able to generate the shapefiles or do the Places project or provide a way to search for photos by place, rather than location.

Enjoy!

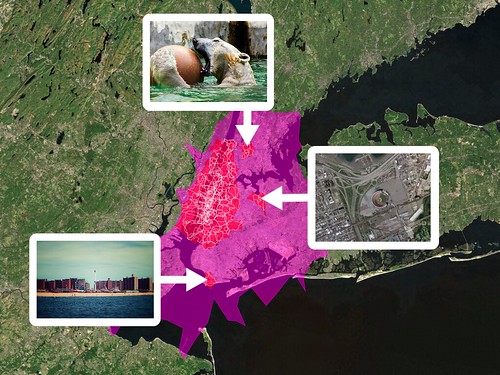
Oh, and those “unidentified” outliers, in New York City, that I mentioned in the last post about the donut hole shapefiles: The Bronx Zoo, Coney Island and Shea Stadium. Of course!

(if you lived here)

photos by ajagendorf25, auggie tolosa and the sky

The Absence and the Anchor

Back in January, I wrote a blog post about some experimental work that I’d been doing with the shapefile data we derive from geotagged photos. I was investigating the idea of generating shapefiles for a given location using not the photos associated with that place but, instead, from the photos associated with the children of that place. For example, London:

London

The larger pink shape is what we (Flickr) think of as the “city” of London. The smaller white shapes are its neighbourhoods. The red shapes represent an entirely new shapefile that we created by collecting all the points for those neighbourhoods and running them through Clustr, the tool we use to generate shapes.

For lack of any better name I called these shapes “donut holes” because, well, because that’s what they look like. The larger shape is a pretty accurate reflection of the greater metropolitain area of London, the place that has grown and evolved over the years out of the city center that most people would recognize in the smaller red shape. Our goal with the shapefiles has always been to use them to better reverse-geocode people’s geotagged photos so these sorts of variations on a theme can better help us understand where a place is.

Like New York City. No one gets New York right including us try as we might (though, in fairness, it’s gotten better recently (no, really)) and even I am hard pressed to explain the giant pink blob, below, that is supposed to be New York City. On the other hand, the red donut hole shape even though (perhaps, because) it spills in to New Jersey a bit is actually a pretty good reflection of the way people move through the city as a whole.

NYC

It could play New York on TV, I think.

I’m not sure how to explain the outliers yet, either, other than to say the shapefiles for city-derived donut holes may contain up to 3 polygons (or “records” in proper Shapefile-speak) compared to a single polygon for plain-old city shapes so if nothing else it’s an indicator of where people are taking photos.

If the shapefiles themselves are uncharted territory, the donut holes are the fuzzy horizon even further off in the distance. We’re not really sure where this will take us but we’re pretty sure there’s something to it all so we’re eager to share it with people and see what they can make of it too.

Vietnam

(This is probably still my favourite shapefile ever.)

Starting today, the donut hole shapes are available for developers to use with their developer magic via the Flickr API.

At the moment we are only rendering donut hole shapefiles for cities and countries. I suppose it might make sense to do the same for continents but we probably won’t render states (or provinces) simply because there is too much empty unphotographed space between the cities to make it very interesting.

There are also relatively few donut holes compared to the corpus of all the available shapefiles so rather than create an entirely new API method we’ve included them in the flickr.places.getShapeHistory API method which returns all the shapefiles ever created for a place. Each shape element now contains an is_donuthole attribute. Here’s what it looks like for London:

<shapes total="6" woe_id="44418" place_id=".2P4je.dBZgMyQ"
	place_type="locality" place_type_id="7">

	<shape created="1241477118" alpha="9.765625E-05" count_points="275464"
		count_edges="333" is_donuthole="1">

		<!-- shape data goes here... -->

	</shape>

	<!-- and so on ->

</shapes>

Meanwhile, the places.getInfo API method has been updated to included a has_donuthole attribute, to help people decide whether it’s worth calling the getShapeHistory method or not. Again, using London as the example:


<place place_id=".2P4je.dBZgMyQ" woeid="44418" latitude="51.506"
       longitude="-0.127" place_url="/United+Kingdom/England/London"
       place_type="locality" place_type_id="7" timezone="Europe/London"
       name="London, England, United Kingdom" has_shapedata="1">

	<shapedata created="1239037710" alpha="0.00029296875" count_points="406594"
                   count_edges="231" has_donuthole="1" is_donuthole="0">

        <!-- and so on -->
</place>

Finally, here’s another picture by Shannon Rankin mostly just because I like her work so much. Enjoy!