The 32 Days Of Christmas!

LEGO City Advent Calendar - Day 7

When you have thousands of photos, it can be hard to find the photo you’re looking for. Want to search for that Christmas cat you saw at last year’s party? And what if that party wasn’t on Christmas day, but sometime the week before? To help improve the search ranking and relevance of national, personal, and religious holiday photos, we first have to see when the photos were taken; when, for example, is the Christmas season?

Understanding what people are looking for when they search for their own photos is an important part of improving Flickr. Earlier this year, we began a study (which will be published at CHI 2016 under the same name as this post) by trying to understand how people searched for their personal photos. We showed a group of 74 participants roughly 20 of their own photos on Flickr, and asked them what they’d put into the Flickr search box to find those photos. We did this a total of 1492 times.

It turns out 12% of the time people used a temporal term in searches for their own photos, meaning a word connected to time in some way. These might include a year (2015), a month (January), a season (winter), or a holiday or special event (Thanksgiving, Eid al-Fitr, Easter, Passover, Burning Man). Often, however, the date and time on the photograph didn’t match the search term: the year would be wrong, or people would search for a photograph of snow the weekend after Thanksgiving with the word “winter,” despite the fact that winter doesn’t officially begin until December 21st in the U.S. So we wanted to understand that situation: how often does fall feel like winter?

To answer this, we mapped 78.8 million Flickr photos tagged with a season name to the date the photo was actually taken.

Seasons Tagged by Date

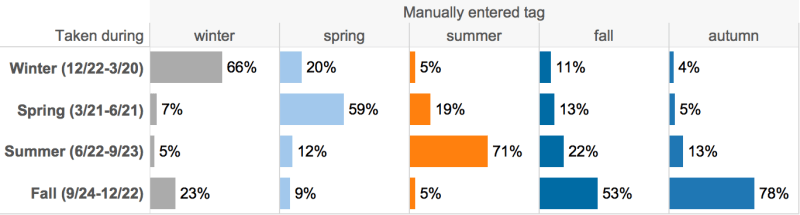
As you’d expect, most of the photographs tagged with a season are taken during that season: 66% of photos tagged “winter” were taken between December 22 and March 20. About 9% of search words are off by two seasons: photos tagged “summer” that were taken between December 21st and March 20th, for example. We expect this may reflect antipodean seasons: while most Flickr users are in the Northern Hemisphere, it doesn’t seem unreasonable that 5% of “summer” photographs might have been taken in the Southern Hemisphere. More interesting, we think, are the off-by-one cases, like fall photographs labeled as “winter,” where we believe that the photo represents the experience of winter, regardless of the objective reality of the calendar. For example, if it snows the day after Thanksgiving, it definitely feels like winter.

On the topic of Thanksgiving, let’s look at photographs tagged “thanksgiving.”

Percentage of Photos Tagged "Thanksgiving"
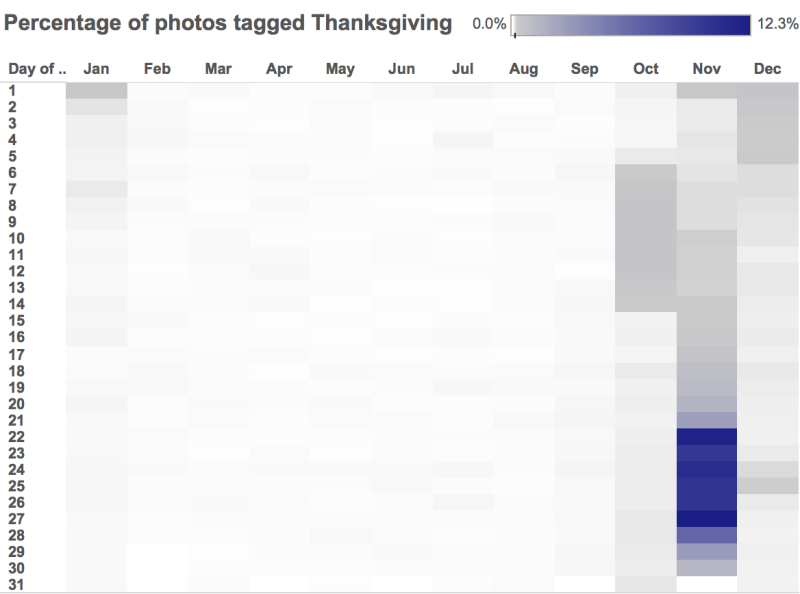
The six days between November 22nd and 27th—the darkest blue area—cover 65% of the photos. Expanding that range to November 15–30th covers 83%. Expanding to all of November covers 85%, and including October (and thus Canadian Thanksgiving, in gray in early October) brings the total to 90%. But that means that 10% of all photos tagged “thanksgiving” are outside of this range. Every date in that image represents a total of a minimum of 40 photographs taken on that day between 2003 and 2014 inclusive, uploaded to Flickr and tagged “thanksgiving” with the only white spaces being days that don’t exist, like February 30th or April 31st. Manual verification of some of the public photos tagged “thanksgiving” on arbitrarily chosen dates finds these photographs tagged “thanksgiving” included pumpkins or turkeys, autumnal leaves or cornucopias—all images culturally associated with the holiday.

Not all temporal search terms are quite so complicated; some holidays are celebrated and photographed on a single day each year, like Canada Day (July 1st) or Boxing Day (December 26th). While these holidays can be easily translated to date queries, other holidays have more complicated temporal patterns. Have a look at these lunar holidays.

Lunar Holidays Tagged by Date

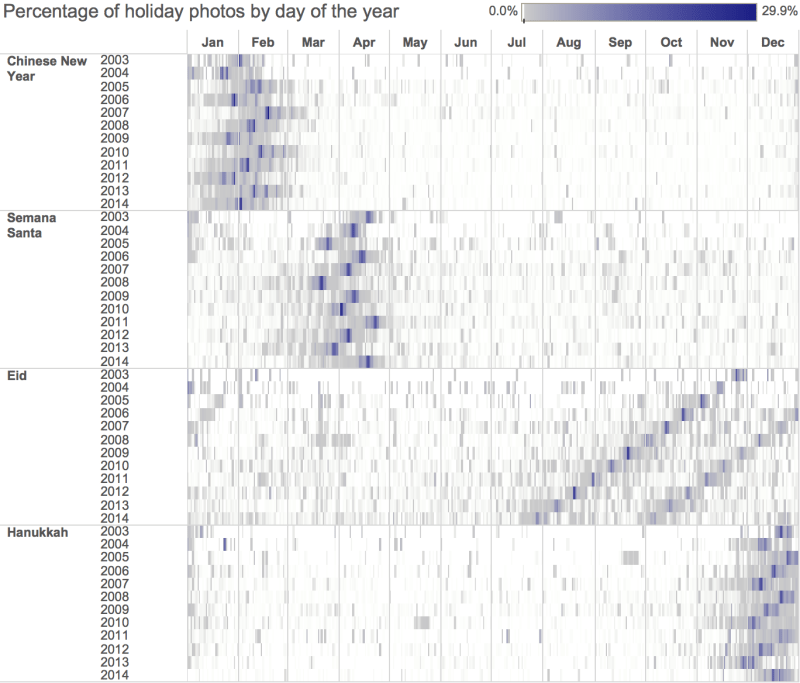
There are some events that occur on a lunar calendar like Chinese New Year, Easter, Eid (both al-Fitr and al-Adha), and Hanukkah. These events move around in a regular, algorithmically determinable, but sometimes complicated, way. Most of these holidays tend to oscillate as a leap calculation is added periodically to synchronize the lunar timing to the solar calendar. However Eids, on the Hijri calendar, have no such leap correction, and we see photos tagged “Eid” edge forward year after year.

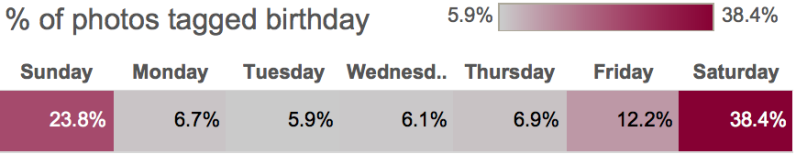
Some holidays and events, like birthdays, happen on every day of the week. But they’re often celebrated, and thus photographed, on Friday, Saturday, and Sunday:

Day of the week tagged Birthday

So to get back to our original question: when are photos tagged “Christmas” actually taken?

Days tagged with Christmas

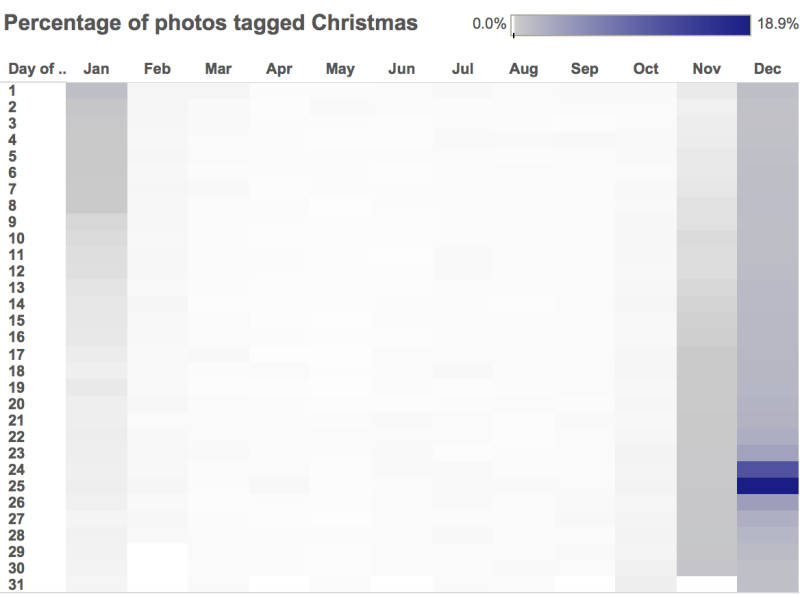
As you can see, more photos tagged “Christmas” are taken on December 25th than on any other day (19%). Christmas Eve is a close second, at 12%. If you look at other languages, this difference practically goes away: 9.2% of photos tagged “Noel” are taken on Christmas Eve, and 9.6% are taken on Christmas; “navidad” photos are 11.3% on Christmas Eve and 12.0% on Christmas. But Christmas photos are taken throughout December. We can now set a threshold for a definition of Christmas: say if at least 1% of the photos tagged “Christmas” were taken on that day, we’d rank it more relevant. That means that every day from December 1st to January 1st hits that definition, with December 2nd barely scraping in. That makes…32 days of Christmas!

Merry Christmas and Happy Holidays—for all the holidays you celebrate and photograph.

PS: Flickr is hiring! Labs is hiring! Come join us!

33 Browser Stats You Just Might Believe

We care an awful lot about the kinds of browsers and computers visiting Flickr. As people update to the latest versions of their browsers, the capabilities we can build against improve, which lets us build cool new things. At the same time, if lots of people continue using older browsers then we have to do extra work to gracefully support them.

These days we not only have incredibly capable browsers, but thanks to the transparent and rapid update process of Chrome, Firefox, and soon Internet Explorer (hooray!), we can rely on new features rapidly showing up en masse. This is crazy great, but it doesn’t mean that we can stop paying attention to our usage statistics. In fact, as people spend more time on their phones, there’s as much of a need for a watchful eye as ever.

We’ve never really shared our internal numbers, but we thought it would be interesting to take a look at the browsers Flickr visitors used in 2014. We use these numbers constantly to inform our project planning. Since limitations in older browsers take time to support we have to be judicious in picking which battles to fight. As you’ll see below, these numbers can be quite dynamic with a popular browser dropping to nearly 0% market-share in just a year. Let’s dive in and see some specifics.

Fort Vancouver
Fort Vancouver by Kate Dickerson

Top level OSes and browsers

At the highest level we learn a lot by looking at our OS family data. Probably the most notable thing here is how much of our traffic is coming from mobile devices. Moreover, the rate of growth is eye-popping. And this is just our website – this data doesn’t include our iOS or Android clients at all. A quarter of our traffic is from mobile devices.

OSes in use on Flickr.com
2013 Q4 2014 Q4 Y/Y
Windows 56.55% 50.61% -5.94
Macintosh 21.49% 21.42% -0.07
iOS 11.09% 17.61% 6.52
Android 5.39% 7.82% 2.43
Other 5.48% 2.54% -2.94

Let’s slice things slightly differently and look at browser families. We greatly differ from internet-wide traffic in that IE isn’t the outright majority browser. In fact, it clocks in at only the #4 position. More than half of Flickr visitors use a Webkit/Webkit-heritage browser (Safari and Chrome, respectively). Chrome rapidly climbed into its leadership position over the last few years and it’s stabilized there. Safari is hugely buoyed by iOS’s incredible growth numbers, while IE has been punished by Windows’s Flickr market-share decline.

Browsers in use on Flickr.com
2013 Q4 2014 Q4 Y/Y
Chrome 35.71% 35.42% -0.29
Safari 24.11% 27.50% 3.39
Firefox 17.94% 18.29% 0.35
Internet Explorer 13.98% 10.31% -3.67
Other 8.26% 8.48% 0.22

Fine-grained details

We can go a step further and see many details in the individual versions of OSes and browsers out there. It’s one thing to say “Windows is down 6% over the year” but another to say “the growth rate for the latest version of Windows is 350% year over year.” When we look at the individual versions we can infer quite a bit of detail around update rates and changes in the landscape.

OS version details

A few highlights:

  • Windows 7 is on the decline, XP and Vista fell by roughly 50% each, and Windows 8 and 8.1 are surging ahead.
  • iOS 8.1 and Android 5.0 don’t appear in the list due to their late appearance in Q4. Our current monthly numbers have iOS 8.1 far outpacing every other iOS version.
  • OS X 10.10 has accelerated Mac user upgrades; since its launch 10.9 has shed over a percent per month, and the legacy versions have sharply accelerated their decline.
OS versions in use on Flickr.com
2013 Q4 2014 Q4 Y/Y
Windows NT 3.39% 0% -3.39
Windows XP 10.12% 4.49% -5.63
Windows Vista 3.56% 2.41% -1.15
Windows 7 36.29% 33.14% -3.15
Windows 8 2.01% 2.31% 0.30
Windows 8.1 1.06% 8.22% 7.16
Macintosh OS X 10.5* 0.65% 0.65
Macintosh OS X 10.6* 2.90% 2.90
Macintosh OS X 10.7* 1.91% 1.91
Macintosh OS X 10.8* 1.83% 1.83
Macintosh OS X 10.9* 8.26% 8.26
Macintosh OS X 10.10 0% 5.69% 5.69
iOS 4.3 0.19% 0% -0.19
iOS 5.0 0.12% 0% -0.12
iOS 5.1 0.59% 0% -0.59
iOS 6.0 0.42% 0% -0.42
iOS 6.1 2.02% 0.61% -1.41
iOS 7.0 7.36% 1.54% -5.82
iOS 7.1 0% 5.76% 5.76
iOS 8.0 0% 3.27% 3.27
Android 2.3 0.77% 0% -0.77
Android 4.0 0.82% 0% -0.82
Android 4.1 2.11% 1.22% -0.89
Android 4.2 0.84% 1.16% 0.32
Android 4.3 0.39% 0.56% 0.17
Android 4.4 0% 3.80% 3.80
Linux 4.37% 1.94% -2.43

* We didn’t start breaking out individual versions of OS X until Q1 2014. So unfortunately for this post we don’t have great info breaking down the versions of OS X, but we will in the future. OS X 10.10 did not exist in Q1 2014 so it’s counted as a natural 0% in our Q1 data.

Browser version details

These are the most dynamic numbers of the bunch. If there’s one thing they prove, it’s how incredibly effective the upgrade policies of Chrome and Firefox are. Where Safari and IE have years-old versions still hanging on (I’m looking at you Safari 5.1 and IE 8.0), virtually every Chrome and Firefox user is using a browser released within the last six weeks. That’s a hugel powerful thing. The IE team has suggested that Windows 10’s Project Spartan will adopt this policy, which is absolutely fantastic news. A few highlights:

  • Despite not being on a continuous upgrade cycle, Safari and IE were able to piggyback on successful OS launches to consolidate their users on their latest releases.
  • IE 8.0 is the only non-latest version of IE still holding on, thanks to its status as the latest version available for the still somewhat popular Windows XP.
OS versions in use on Flickr.com
2013 Q4 2014 Q4 Y/Y
Chrome 22.0.1229 1.67% 0% -1.67
Chrome 29.0.1547.76 1.39% 0% -1.39
Chrome 30.0.1599.101 8.94% 0% -8.94
Chrome 30.0.1599.69 3.74% 0% -3.74
Chrome 31.0.1650.57 6.08% 0% -6.08
Chrome 31.0.1650.63 6.91% 0% -6.91
Chrome 37.0.2062.124 0% 4.59% 4.59
Chrome 38.0.2125.104 0% 3.05% 3.05
Chrome 38.0.2125.111 0% 6.65% 6.65
Chrome 39.0.2171.71 0% 4.09% 4.09
Chrome 39.0.2171.95 0% 4.51% 4.51
Safari 5.0 1.96% 0% -1.96
Safari 5.1 5.60% 2.50% -3.10
Safari 6.0 6.21% 0.86% -5.35
Safari 7.0 7.29% 7.25% -0.04
Safari 7.1 0% 3.12% 3.12
Safari 8.0 0% 10.10% 10.10
Firefox 22.0 1.62% 0% -1.62
Firefox 24.0 5.50% 0% -5.50
Firefox 25.0 6.46% 0% -6.46
Firefox 26.0 1.90% 0% -1.90
Firefox 32.0 0% 4.92% 4.92
Firefox 33.0 0% 7.10% 7.10
Firefox 34.0 0% 3.52% 3.52
MSIE 8.0 3.69% 1.00% -2.69
MSIE 9.0 3.04% 1.22% -1.82
MSIE 10.0 5.94% 0% -5.94
MSIE 11.0 0% 6.69% 6.69
Generic WebKit 4.0* 3.18% 2.46% -0.72
Mozilla 5.0* 3.18% 4.80% 1.62
Opera 9.80 1.46% 0% -1.46

* These are catch-all versions of Mozilla-based and Webkit-based browsers that aren’t themselves Firefox, Safari, or Chrome.

A word on methodology

These numbers were anonymously collected using Yahoo’s in-house metrics libraries. The numbers here are aggregated over the course of three months each, making these numbers lagging indicators. This is why the latest releases, like Android 5.0 and iOS 8.1, are under-represented – they hadn’t yet enjoyed one full quarter when 2014 came to a close.

Further reading

There are a number of excellent sites out there watching similar browser statistics on a continuing basis. A few of them are:

  • Ars Technica – on a monthly basis they analyze raw data from Net Market Share with insightful commentary.
  • Net Market Share – while Ars does a bang-up job, it’s helpful to sift the data yourself to find the answers to your questions.
  • Peter-Paul Koch – No one shines a sharper light on the state of browsers than PPK, with just one example being his attention to disambiguating the various versions of Chromium out there (part two).


Flickr September 2014

Like this post? Have a love of online photography? Want to work with us? Flickr is hiring engineers, designers and product managers in our San Francisco office. Find out more at flickr.com/jobs.