The Ins and Outs of the Yahoo Flickr Creative Commons 100 Million Dataset

This past summer we (Yahoo Labs and Flickr) released the YFCC100M dataset that is the largest and most ambitious collection of Flickr photos and videos ever, containing 99,206,564 photos and 793,436 videos from 581,099 different photographers. We’re super excited about the dataset, because it is a reflection of how Flickr and photography have evolved over the past 10 years. And it contains photos and videos of almost everything under the sun (and yes, loads of cats).

We’ve received a lot of emails and tweets asking for more details about the dataset, so in this blog post, we’ll gladly tell you. Each of the 100 million photos and videos is associated with a Creative Commons license that indicates how it may be used by others. The table below shows the complete breakdown of licenses in our dataset. Approximately 31.8% is marked for commercial use, while 17.3% has the most liberal license, which only requires attribution to the photographer.

License Photos Videos
17,210,144 137,503
9,408,154 72,116
4,910,766 37,542
12,674,885 102,288
28,776,835 235,319
26,225,780 208,668

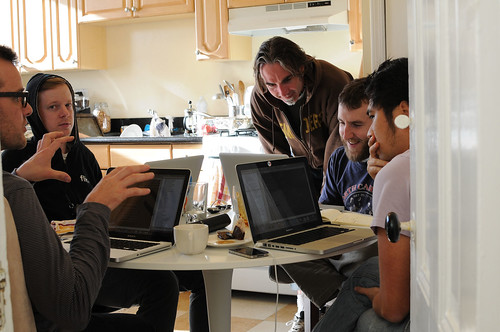
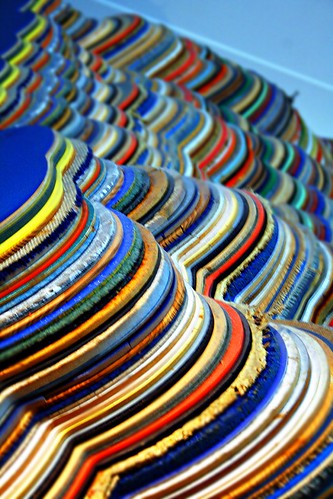
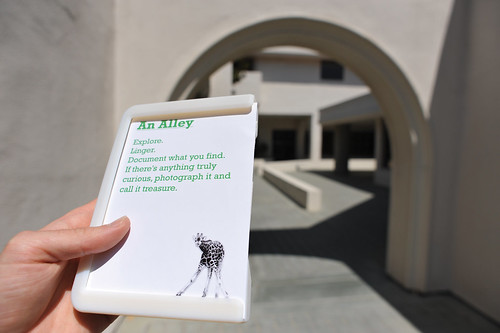
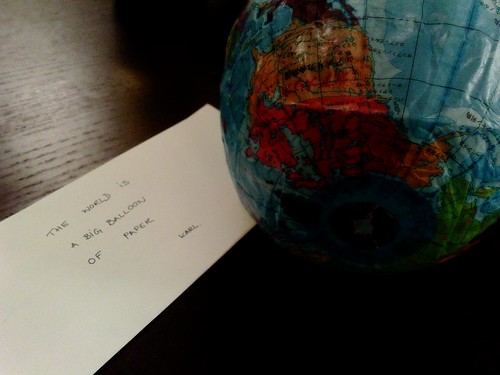
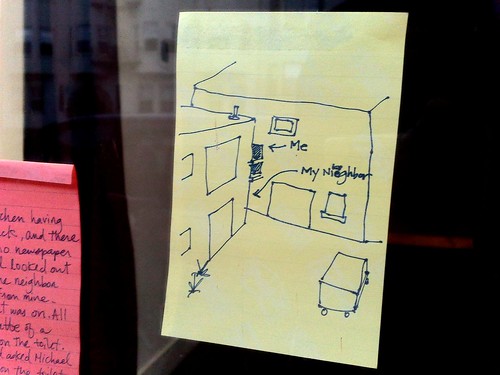
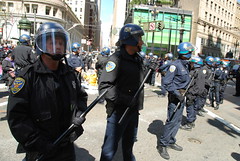
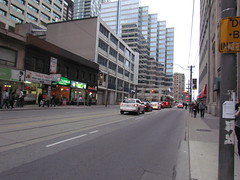
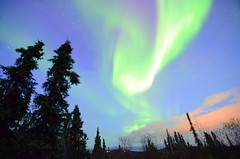
The photos and videos themselves are very diverse. We’ve found photos showing street scenes captured as part of photographer Andy Nystrom‘s life-logging activities, photos of real-world events like protests and rallies, as well as photos of natural phenomena.

Five years of Iraq war die-in IMG_9793 851-Aurora Borealis Northern Lights from Lodge near Fairbanks 1 Sep 28, 2011 1-11 AM 1600x1060
Steve Rhodes
Andy Nystrom
BJ Graf

To understand more about the visual content of the photos in the dataset, the Flickr Vision team used a deep-learning approach to find the presence of visual concepts, such as people, animals, objects, events, architecture, and scenery across a large sample of the corpus. There’s a diverse collection of visual concepts present in the photos and videos, ranging from indoor to outdoor images, faces to food, nature to automobiles.

Concept Count
outdoor 32,968,167
indoor 12,522,140
face 8,462,783
people 8,462,783
building 4,714,916
animal 3,515,971
nature 3,281,513
landscape 3,080,696
tree 2,885,045
sports 2,817,425
architecture 2,539,511
plant 2,533,575
house 2,258,396
groupshot 2,249,707
vehicle 2,064,329
water 2,040,048
mountain 2,017,749
automobile 1,351,444
car 1,340,751
food 1,218,207
concert 1,174,346
flower 1,164,607
game 1,110,219
text 1,105,763
night 1,105,296

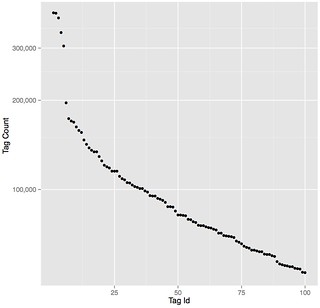
There are 68,971,123 photos and videos in the set that have user-annotated tags. If we look at specific tags used, we see it is very common for people to use the year of capture, the camera brand, place names, scenery, and activities as tags. The top 25 tags (excluding the years of capture) and how often they were used are listed below, as well as the tag frequency distribution for the 100 most-frequently used tags.

User Tag Count
nikon 1,195,576
travel 1,195,467
usa 1,188,344
canon 1,101,769
london 996,166
japan 932,294
france 917,578
nature 872,029
art 854,669
music 826,692
europe 782,932
beach 758,799
united states 743,470
england 739,346
wedding 728,240
city 689,518
italy 688,743
canada 686,254
new york 685,311
vacation 680,142
germany 672,819
party 663,968
park 651,717
people 641,285
water 640,234

User tag distribution in the YFCC100M Dataset

Some photos and videos (3,350,768 to be exact) carry machine tags. Noteworthy machine tags are those having the “siwild” namespace, referring to photos uploaded by scientists of the Smithsonian, and the “taxonomy” namespace, which refers to photos in which flora and fauna have been carefully classified. The most frequently occurring namespace, “uploaded,” refers to the applications used to share the photos on Flickr, which are principally the Flickr and Instagram iOS apps. Other interesting machine tags are those referring to the different filters that can be applied to a photo, or roughly 750,000 photos. Overall, most machine tags are related to food and drink, events, camera and application metadata, as well as locations.

Machine Tag Count
uploaded 1,917,650
siwild 1,169,957
taxonomy 1,067,857
foursquare 894,265
exif 617,287
flickriosapp 538,829
geo 443,762
sequence 429,948
lastfm 313,379
flickrandroidapp 222,238

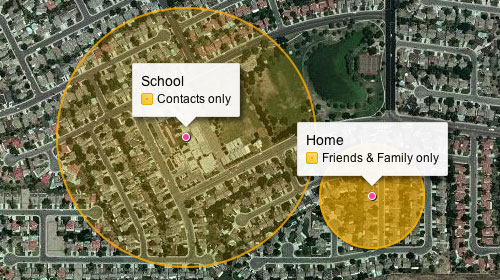
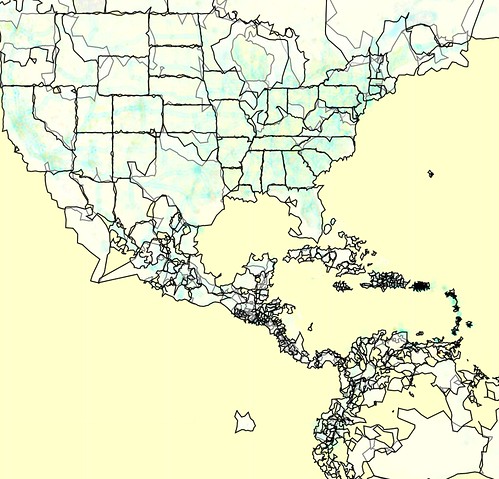
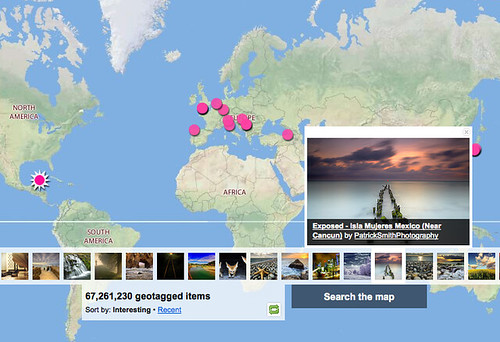
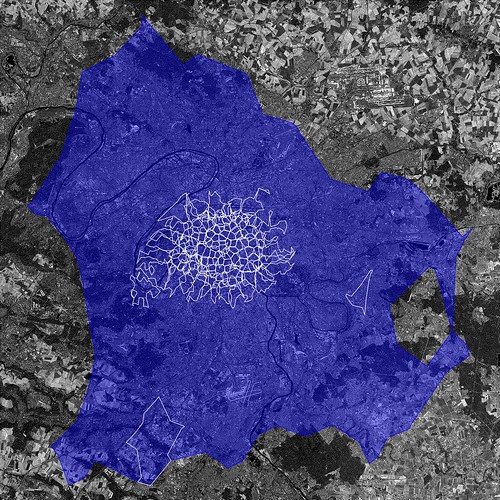
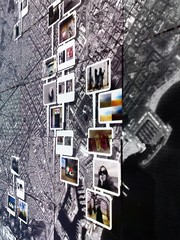
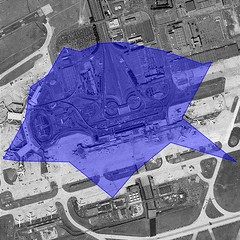
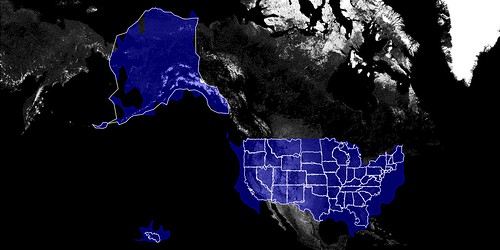
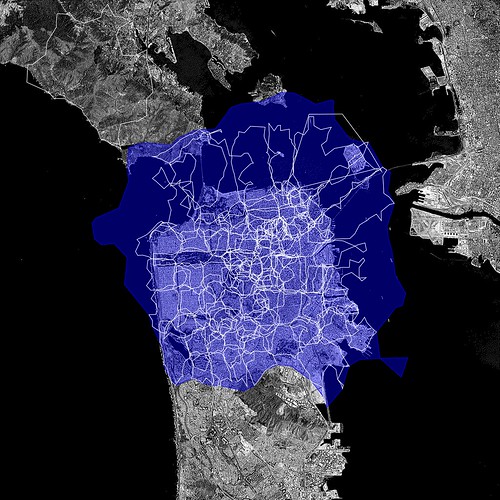
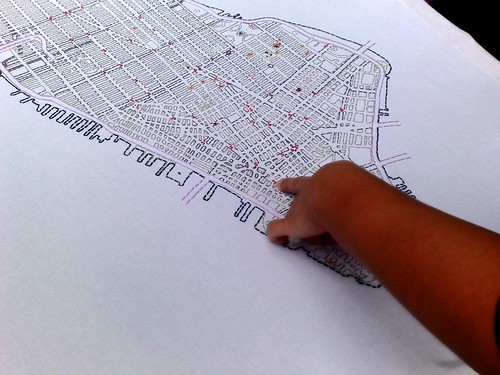
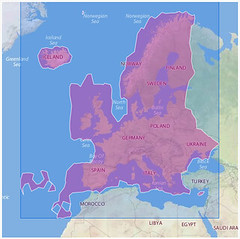
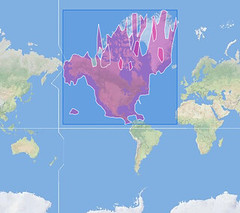
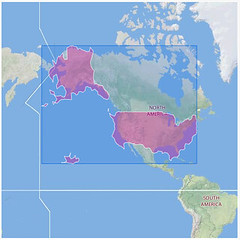
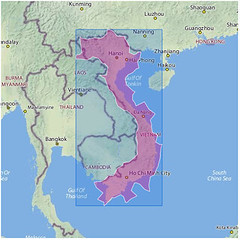
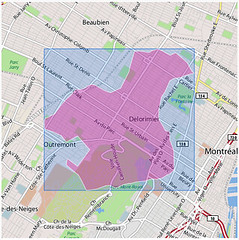
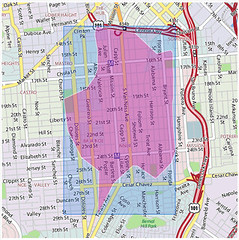
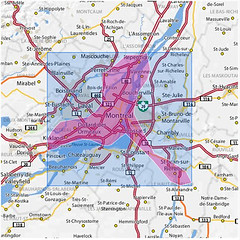
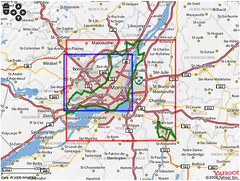
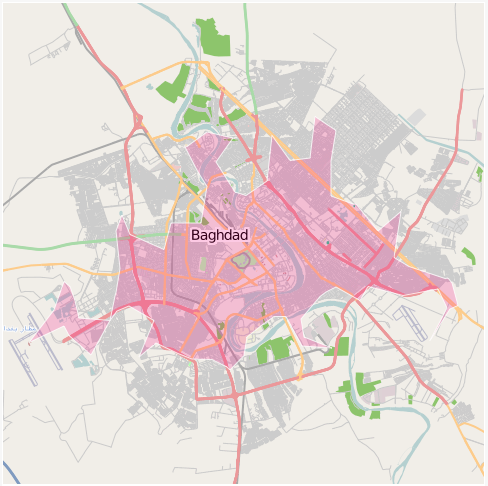
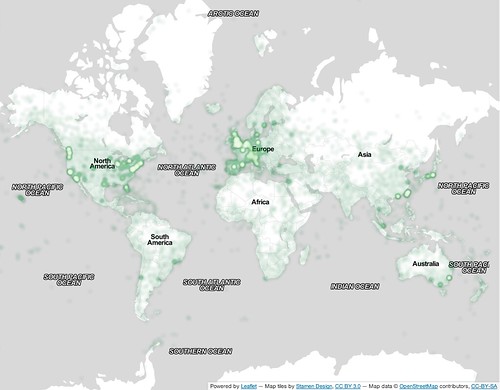
In terms of locations, the photos and videos in the dataset have been taken all over the world. In total, 48,366,323 photos and 103,506 videos were geotagged. The most popular cities where photos and videos were shot are concentrated in the United States, principally New York City, San Francisco, Los Angeles, Chicago, and Seattle; in Europe, they were principally London, Berlin, Barcelona, Rome and Amsterdam. There are also photos that have been taken in remote locations like Kiribati, icy places like Svalbard, and exotic places like Comoros. In fact, photos and videos from this dataset have been taken in 249 different territories (countries, islands, etc) around the world, and even in international waters or airspace.

One Million Creative Commons Geo-tagged Photos

Our dataset further reveals that there are many different cameras in use within the Flickr community. The Canon EOS 400D and 350D have a lead over the Nikon D90 (calm down…we’re not starting anything by saying that). Apple’s iPhones form the most popular type of cameraphone.

Make Camera Count
Canon EOS 400D 2,539,571
Canon EOS 350D 2,140,722
Nikon D90 1,998,637
Canon EOS 5D Mark II 1,896,219
Nikon D80 1,719,045
Canon EOS 7D 1,526,158
Canon EOS 450D 1,509,334
Nikon D40 1,358,791
Canon EOS 40D 1,334,891
Canon EOS 550D 1,175,229
Nikon D7000 1,068,591
Nikon D300 1,053,745
Nikon D50 1,032,019
Canon EOS 500D 1,031,044
Nikon D700 942,806
Apple iPhone 4 922,675
Nikon D200 919,688
Canon EOS 20D 843,133
Canon EOS 50D 831,570
Canon EOS 30D 820,838
Canon EOS 60D 772,700
Apple iPhone 4S 761,231
Apple iPhone 743,735
Nikon D70 742,591
Canon EOS 5D 699,381

Our collection of 100 million photos and videos marks a new milestone in the history of datasets. The collection is one of the largest released for academic use, and it’s incredibly varied—not just in terms of the content shown in the photos and videos, but also the locations where they were taken, the photographers who took them, the tags that were applied, the cameras that were used, etc. The best thing about the dataset is that it is completely free to download by anyone, given that all photos and videos have a Creative Commons license. Whether you are a researcher, a developer, a hobbyist or just plain curious about online photography, the dataset is the best way to study and explore a wide sample of Flickr photos and videos.  Happy researching and happy hacking!

We saved you a step…

It seems when we launched version 2.0 of our Flickr shapes, we posted them with a flaw which made them useless to most popular geo applications.

Awwwww…

Luckily, Christopher Manning wrote a python script which makes them useful.

Yaaaayyyyy!

The least we can do is post an update which has already been christopher-manning-ified, So, we are very happy to announce version 2.0.1 of the Flickr shape files which can be downloaded here:
http://www.flickr.com/services/shapefiles/2.0.1/

Look, it works:


Flickr Shapes 2.0.1 in TileMill

A very hearty THANKS! from your friends at Flickr, Christopher.

In the privacy of our homes

The best thing about working at Flickr is that my coworkers all love the site and product ideas can come from anyone.

Recently, the Flickr staff had to work from home while our office was disassembled and relocated a few floors down. A chance to sleep in and start the weekend early? Or get together with a few ambitious coworkers and hack together a new feature?

We met at Nolan’s house, ate a farmer’s breakfast, and brainstormed.

Flickr Satellite Office

We wanted to build something fun, which a few of us could start working on that morning and have a demo ready by the end of the day. Something suited to the talents and interests of the people in the room. Secret Faves? Risqué Explore?

Bert wanted to help people geotag more photos, but he wanted more sophisticated privacy controls first. I’d been using a simple web app that I built with the Flickr API to manage the geo privacy of my photos, and it seemed like something more people should have access to.

So we had a need. We had a proof of concept. We had enough highly caffeinated engineers to fill a small dinner table. “Let’s build geofences.”

What the beep is a geofence?

Parked outside a school! by Dunstan

You probably know what geotagging is. It’s nerd-speak for putting your photos on a map. Flickr pioneered geotagging about five years ago, and our members have geotagged around 300 million photos and videos.

We’ve always offered the same privacy settings for location data that we offer for commenting, tagging, and who can see your photos. You have default settings for your account, which are applied to all new uploads, and which you can override on a photo-by-photo basis.

This works well for most metadata. I have a few photos that I don’t want people to comment on or add notes to, but for the most part, one setting fits all my needs.

But geo is special. I often override my default geo privacy. Every time I upload a photo taken at my house, I mark it “Contacts only”. Same for my grandma’s house. And that dark place with the goats and candles? Sorry, it’s private.

Managing geo privacy by hand is tedious and error prone. Geofences make it easier.

geofences

Geofences are special locations that deserve their own geo privacy settings. Simply draw a circle on a map, choose a geo privacy setting for that area, and you’re done. Existing photos in that location are updated with your new setting, and any time you geotag a photo in that area, it gets that setting too.

Geofences are applied at upload time, or when you geotag a photo after uploading it. It doesn’t matter how you upload or tag your photos: The Organizr, the map on your photo page, and the API all use geofences.

If you’re ready to dive in, visit your account geo privacy page and make your first geofence.

Boring details

When dealing with privacy, we need to be conservative, reliable, and have clearly defined rules. The geofences concept is simple, but the edge cases can be confusing.

no geofences, common use case
No geofencesCommon use case

  • What happens when you have overlapping geofences?
  • What if you move a photo from outside a geofence to inside one?
  • Where does your default geo privacy setting fit in?

The vast majority of Flickr members will never encounter these edge cases. But when they do, Flickr plays it safe and chooses the most private setting from the following options:

  • The member’s default geo privacy
  • The current geo privacy of the photo (if it was already geotagged)
  • Any geofences for the new location

If your account default is more private than your geofences, the geofences won’t take effect. If you have overlapping geofences for a point, the most private one will take effect. If you move a photo whose location was private into a contacts-only geofence, it will stay private.

overlapping geofences, more private account default
Overlapping geofencesMore private account default

As a reminder, here’s the ranking of our privacy settings:

Note that friends and family are at the same level in the hierarchy. Your family shouldn’t see locations marked as friends only, and vice versa.

With that in mind, what should Flickr do when someone geotags a photo where friends and family overlap? Maybe he wants both friends and family to see it, or maybe he wants neither friends nor family to see it. To really be safe, we must make that location completely private.

friends and family overlap
Friends and family overlap

Go forth and geotag

A few years ago, privacy controls like this would have been overkill. Geo data was new and underused, and the answer to privacy concerns was often, “you upload it, you deal with it.”

But today, physical places are important to how we use the web. Sometimes you want everyone to know exactly where you took a photo. And sometimes you don’t.

Flickr Shapefiles Public Dataset 2.0

An embarrassingly long time ago we released the first public version of the Flickr Shapefiles. What does this have to do with Captain America and a cat? Nothing, really.

Anyway, we haven’t completely forgotten about shapefiles and have finally gotten around to generating a new batch (read about Alpha Shapes to find out how it’s done). When Aaron did the first run we had somewhere around ninety million (90M) geotagged photos. Today we have over one hundred and ninety million (190M) and that number is growing rapidly. Of course lots of those will fall within the boundaries of the existing shapes and won’t give us any new information, but some of them will improve the boundaries of old shapes, and others will help create new shapes where there weren’t any before. Version 1 of the dataset had shapes for around one hundred and eighty thousand (180K) WOE IDs, and now we have shapes for roughly two hundred and seventy thousand (270K) WOE IDs. Woo.

The dataset is available for download today, available for use under the Creative Commons Zero Waiver:

http://www.flickr.com/services/shapefiles/2.0/

Little Johnny JSON

Today I'm a Cop.

Originally we provided the full dataset in our own home-grown XML format because, well, it seemed like a good idea. For version two we’re releasing the shapes in GeoJSON format. We think this is a Good Thing because unlike our  old XML format, at least one other person in the world already knows how to read and write GeoJSON. For example, Our friends over at Stamen Design and SimpleGeo have created a ridiculously easy-to-use JavaScript library called Polymaps which of course reads GeoJSON out of the box. With a few lines of JavaScript you can render the Flickr shapefiles and start using them without all that pesky XML parsing stuff:

Statez

Or if GeoJSON doesn’t suit you you can use a free tool like ogr2ogr to convert it to something that does.

Layers

1000 layers

(photo by doug88888)

The GeoJSON format allows grouping of features (and their related geometries) into FeatureCollection objects. A FeatureCollection seems to be roughly equivalent to a layer in a typical GIS, or a placetype in WhereOnEarth-speak. To make the dataset a little easier to manage we decided to break the shapes up into FeatureCollections based on placetype; one each for continents, countries, regions (states), counties, localities (cities), and neighbourhoods. Each of these is its own GeoJSON file in the dataset.

Here’s an example of what one of our GeoJSON objects looks like:

{
  "type": "FeatureCollection",
  "name": "Flickr Shapes Public Dataset 2.0 - Regions",
  "features": [
    {
      "type": "Feature",
      "id": 2344541,
      "properties": {
      "woe_id": 2344541,
      "place_id": "Cxf0SmObApi9R9T8",
      "place_type": "region",
      "place_type_id": 8,
      "label": "Barbuda, AG, Antigua and Barbuda",
    },
    "geometry":
    {
      "type": "MultiPolygon",
      "created": 1292444482,
      "alpha": 0.03,
      "points": 118,
      "edges": 17,
      "is_donuthole": 0,
      "link": {
        "href": "http://farm6.static.flickr.com/5209/shapefiles/2344541_20101215_724c4cae47.tar.gz",
      },
      "bbox": [-62.314453125,17.086019515991,-61.690979003906,17.93692779541],
      "coordinates": [
        [
          [[-61.739044,17.587740], [-61.735268,17.546171], [-61.690979,17.426649], [-61.765137,17.413546]
... etc

A file is a single FeatureCollection object which holds an array of Features, which each hold a Geometry which is a MultiPolygon, which holds an array of Polygons which in turn each consist of an array of LinearRings. Got it?

You’ve Been Superseded

We’ve also included a separate file/layer called flickr_shapes_superseded.geojson. This is a FeatureCollection that consists of all the WOE IDs that have been “superseded”. Occasionally (too often?) a WOE ID needs to be retired and replaced with a new one. We keep up to date with these and are always reverse-geocoding against the latest WOE IDs. However, there are plenty of old photos (and Flickr shapes) that have been assigned to one of these old IDs, and we have shapes for them (currently a little more than nine thousand). A simple solution might be to just re-assign these photos to the new WOE IDs (when a WOE ID is retired its replacement is specified), or even just re-run the reverse-geocoding process. This may not be what the owner of the photo wants; it might come out with a different result than they had at first (which they may have been perfectly happy with), if the size and location of the WOE rectangle changed (which it probably did). So it’s a problem without a clear solution. And since we have data for these old WOE IDs we’ve included their associated shapes in the dataset. In most cases there will be shapes corresponding to the new WOE IDs that will over time become more and more accurate as more photos get uploaded and end up being assigned to the new WOE IDs. But you can have the old ones too.

WTF

Sometimes, Clustr just gets it wrong. As mentioned in previous posts many of the Flickr shapes are just plain weird. It may be due to a lack of data (i.e. source photos), a weakness of the algorithm, an inappropriate choice of the alpha parameter or (shame!) a plain old bug. One of the things that surprised us was that Clustr was not supposed to output inner rings, or polygons with holes. It turns out that it does. In the GeoJSON output this can cause some weirdness (depending on what you use to render the shapes) since the GeoJSON is formatted with the assumption that each ring is a distinct polygon, instead of possibly one part of a single polygon with holes in it. This and other weirdness are known issues and something we shall strive to fix in the future, however we felt it best to release the existing dataset now rather than spend forever trying to get it perfect, and end up not releasing anything at all.

You may also notice that unlike version 1 of the dataset, there is only a single shape per WOE ID. All of the previous versions of the shapes are still available via the Flickr API, but in the interests of keeping the file size down we’ve limited this download to just the latest versions of each shape.

And as always, there’s lots more to do.

[changelog] Yahoo! updated map tiles and some OSM ones.

Recently Yahoo!! released new map tiles … ah heck, actually it was a couple of months ago, I just suck at writing blog posts … anyway, here’s their post from last December: Yahoo! Maps – New International Coverage which goes on to say …

“We’ve added detailed coverage to 45 new countries, with new data in a further 30 countries, to make it easier for you to navigate to exotic locales as you plan for your winter travel.”

I’m as keen as the next person to have 45 new countries, so I bumped our version of the maps API used over here at Flickr to make use of the new tiles.

Which gives us more to work with for many bits of Albania, Andorra, Argentina, Australia, Austria, Bahrain, Belarus, Belgium, Bosnia & Herzegovina, Botswana, Brazil, Bulgaria, Canada, Croatia, Cyprus, Czech Republic, Denmark, Estonia, Finland, France, Germany, Gibraltar, Greece, Hong Kong, Hungary, Iceland, India, Indonesia, Ireland, Italy, Kuwait, Latvia, Lesotho, Liechtenstein, Lithuania, Luxembourg, Macau-China, Macedonia, Malaysia, Malta, Mexico, Moldova, Monaco, Montenegro, Namibia, Netherlands, New Zealand, Norway, Oman, Philippines, Poland, Portugal, Qatar, Romania, Russia, San Marino, Saudi Arabia, Serbia, Singapore, Slovakia, Slovenia, South Africa, South Korea, Spain, Swaziland, Sweden, Switzerland, Taiwan, Thailand, Turkey, US, United Arab Emirates, United Kingdom and [catch breath], Vietnam.

Often we’ll try to improve our coverage with the help of (the frankly awesome) OpenStreetMap (OSM) peeps, as previously mentioned in; Around the World and Back Again, Flickr [heart] Burning Man [heart] OpenStreetMap and More new map tiles.

With this roll out we’ve actually removed some OSM tiles. Mexico City, Rio de Janeiro, Sao Paulo are now covered in more detail by Yahoo! … here’s the tiles for Mexico City …

Mexico City - Yahoo Map Tiles

… which as you can see are pretty good.

But from OpenStreetMap we’ve added Accra, Algiers, Cairo, Harare, Kinshasa, Mogadishu and Nairobi, you can see the before and after for Nairobi below …

Before

Nairobi - Yahoo Tiles

After, with OSM Tiles

Nairobi OSM tiles

… which as you can see are also pretty good :)

Clearly we can’t spend forever swapping tiles in and out, well maybe we can, but at some point there’ll probably be a better way of managing this kind of thing.

In the meantime though, this being the code blog, and just for fun, here’s a little bit of what happens in the world of JavaScript.

Warning, some code ahead!

This check_map function is called each time you move, zoom or switch map views …

check_map: function(map_obj, parent_node) {
	
	//	Grab the focus, zoomlevel and maptype of the current view
	var lat_lon	=	map_obj.getCenterLatLon();
	var zl 		=	map_obj.getZoomLevel();
	var map_type 	=	map_obj.getCurrentMapType();

Then we check the location against a list of places we want to load OSM tiles for, we could do this any number of ways, but pragmatically this just works (scroll the below code all the way to the right for the interesting bits, if you’re not reading this in an RSS feed) …

	//	Now see if we match any of these following tests to work out if we need to switch to osm or not.
	//	The meta-test is if we are in MAP mode.
	var in_the_zone = false;
	if (map_type == 'YAHOO_MAP') {
		if (zl < 8 && lat_lon.Lat >= 39.8558502197 && lat_lon.Lat <= 40.0156097412 && lat_lon.Lon >= 116.2662734985 && lat_lon.Lon <= 116.4829177856) in_the_zone = true;		// Beijing
		if (zl < 7 && lat_lon.Lat >= 40.735551 && lat_lon.Lat <= 40.807533 && lat_lon.Lon >= -119.272041 && lat_lon.Lon <= -119.163379) in_the_zone = true;				// Black Rock City, 2008
		if (zl < 9 && lat_lon.Lat >= 35.46290704974905 && lat_lon.Lat <= 36.02799998329552 && lat_lon.Lon >= 139.21875 && lat_lon.Lon <= 140.27069091796875) in_the_zone = true;	// Tokyo
		if (zl < 8 && lat_lon.Lat >= -34.6944313049 && lat_lon.Lat <= -34.4146499634 && lat_lon.Lon >= -58.6389389038 && lat_lon.Lon <= -58.2992210388) in_the_zone = true; 		// Buenos Aires
	// Yahoo Better	if (zl < 8 && lat_lon.Lat >= 18.9466495514 && lat_lon.Lat <= 19.6985702515 && lat_lon.Lon >= -99.5071487427 && lat_lon.Lon <= -98.7429122925) in_the_zone = true; 	// Mexico City
	// Yahoo Better	if (zl < 8 && lat_lon.Lat >= -23.0837802887 && lat_lon.Lat <= -22.7662200928 && lat_lon.Lon >= -43.7946395874 && lat_lon.Lon <= -43.1328392029) in_the_zone = true; 	// Rio de Janeiro
	// Yahoo Better	if (zl < 8 && lat_lon.Lat >= -24.0083808899 && lat_lon.Lat <= -23.3576107025 && lat_lon.Lon >= -46.8253898621 && lat_lon.Lon <= -46.3648300171) in_the_zone = true; 	// Sao Paulo
	
		if (zl < 8 && lat_lon.Lat >= -35.2210502625 && lat_lon.Lat <= -34.6507987976 && lat_lon.Lon >= 138.4653778076 && lat_lon.Lon <= 138.7634735107) in_the_zone = true; 		// Adelaide
		if (zl < 8 && lat_lon.Lat >= -34.1896095276 && lat_lon.Lat <= -33.5781402588 && lat_lon.Lon >= 150.5171661377 && lat_lon.Lon <= 151.3425750732) in_the_zone = true; 		// Sydney
		if (zl < 8 && lat_lon.Lat >= -27.8130893707 && lat_lon.Lat <= -27.0251598358 && lat_lon.Lon >= 152.6393127441 && lat_lon.Lon <= 153.3230438232) in_the_zone = true; 		// Brisbane
		if (zl < 8 && lat_lon.Lat >= -35.4803314209 && lat_lon.Lat <= -35.1245193481 && lat_lon.Lon >= 148.9959259033 && lat_lon.Lon <= 149.2332458496) in_the_zone = true; 		// Canberra
		if (zl < 8 && lat_lon.Lat >= -38.4112510681 && lat_lon.Lat <= -37.5401115417 && lat_lon.Lon >= 144.5532073975 && lat_lon.Lon <= 145.5077362061) in_the_zone = true; 		// Melbourne
	
		if (zl < 8 && lat_lon.Lat >= 33.2156982422 && lat_lon.Lat <= 33.4300994873 && lat_lon.Lon >= 44.2592010498 && lat_lon.Lon <= 44.5364112854) in_the_zone = true; 		// baghdad
		if (zl < 8 && lat_lon.Lat >= 34.4611015320 && lat_lon.Lat <= 34.5925598145 && lat_lon.Lon >= 69.0997009277 && lat_lon.Lon <= 69.2699813843) in_the_zone = true; 		// kabul
	
		if (zl < 10 && lat_lon.Lat >= -4.3634901047 && lat_lon.Lat <= -4.3009300232 && lat_lon.Lon >= 15.2374696732 && lat_lon.Lon <= 15.3460502625) in_the_zone = true; 		// kinshasa
		if (zl < 10 && lat_lon.Lat >= 2.0093801022 && lat_lon.Lat <= 2.0614199638 && lat_lon.Lon >= 45.3139114380 && lat_lon.Lon <= 45.3669013977) in_the_zone = true; 			// mogadishu
		if (zl < 10 && lat_lon.Lat >= -17.8511505127 && lat_lon.Lat <= -17.7955493927 && lat_lon.Lon >= 31.0210304260 && lat_lon.Lon <= 31.0794296265) in_the_zone = true; 		// harare
		if (zl < 10 && lat_lon.Lat >= -1.3165600300 && lat_lon.Lat <= -1.2379800081 && lat_lon.Lon >= 36.7483406067 && lat_lon.Lon <= 36.8735618591) in_the_zone = true; 		// nairobi
		if (zl < 10 && lat_lon.Lat >= 5.5237197876 && lat_lon.Lat <= 5.5998301506 && lat_lon.Lon >= -0.2535800040 && lat_lon.Lon <= -0.1586299986) in_the_zone = true; 			// accra
		if (zl < 10 && lat_lon.Lat >= 30.0068798065 && lat_lon.Lat <= 30.1119003296 && lat_lon.Lon >= 31.2149791718 && lat_lon.Lon <= 31.3111705780) in_the_zone = true; 		// cairo
		if (zl < 10 && lat_lon.Lat >= 36.6997604370 && lat_lon.Lat <= 36.8181610107 && lat_lon.Lon >= 2.9909501076 && lat_lon.Lon <= 3.1476099491) in_the_zone = true; 			// algiers
	
	}

If we found a match up there, then "in_the_zone" would have been set, in which case we'll check to see if were already showing osm tiles, if not we'll tell the YAHOO API to use our OSM tiles rather than the YAHOO ones ...

	//	ok, if we've match one of the above tests then we are in osm land ...
	if (in_the_zone) {
	
		//	if we aren't already osming, then we need to switch the map tiles.
		if (!this.osming) {
			
			//	Say that we are now osming
			this.osming = true;
			//	Put the new tiles in
			YMapConfig.tileReg=['/our_openstreetmap_tile_broker.xxx?t=m&','/our_openstreetmap_tile_broker.xxx?t=m&'];
	
			//	Tell the maps to clear out the tile cache and load in the new tiles.
			map_obj._cleanTileCache();
			map_obj._callTiles();
		}
	} else {
 

"YMapConfig.tileReg=" tells the map API to load tiles from us rather than the default ones, hint, you should set this to your own tile server ;)

"_cleanTileCache()" and "_callTiles()" are two undocumented functions (and therefor may break at some point) that allows you to force the map to load in new tiles. Otherwise the current view of the map will still show the Yahoo tiles and not use the new ones until you next pan the map around. Again there's probably a better way of doing this, but there's still a lot to be said for it-just-works!

The next bit runs if we're not "in the zone" to see if we need to turn the OSM tiles back off.

	//	otherwise we are not looking at an osm spot, in which case check to see if
	//	we *were* looking at one, and if so, turn it all off again
		if (this.osming == true) {
			//	say that we are no longer osming
			this.osming = false;
			//	turn the tiles back
			YMapConfig.tileReg=this.oldTileReg;
			
			//	Tell the maps to clear out the tile cache and load in the new tiles.
			map_obj._cleanTileCache();
			map_obj._callTiles();
		}
	}

Which is roughly the opposite of turning them on. The only thing to note is that is the line ...

YMapConfig.tileReg=this.oldTileReg

... when we created the map I used this ...

//	record what the old tiles were
this.oldTileReg=YMapConfig.tileReg;

... to record where YMapConfig thinks it aught to be loading tiles from when in map view (as opposed to hybrid or satellite view) so it can be reset when you need it.

And that's pretty much it. I've chopped out some distracting bits here or there to make it clearer and no-one else is likely to do it like this, but I find sharing to be cathartic (adjective not noun) :)

For a smidge of further reading this is a handy article from A List Apart: Take Control of Your Maps by Paul Smith.

100,000,000 geotagged photos (plus)

Over the weekend we broke the Hundred Million geotagged photos, actually 100,868,302 at last count, mark. If we remember that we passed the 3 billion photos recently and round the figure down a little that means (does calculations on fingers) that around 3.333% of photos have geo data, or one in every 30 photos that get uploaded.

In the last two and a half years there have been roughly as many geotagged photos as the total photos upload to Flickr in its first two years of existence.

Of those, around two thirds have public geotags and can be searched for on the map or via the API, and about 33 million have some level of private geotags.

Flickr: Explore everyone's photos on a Map

I should probably mention at this point that if you go directly to the map and click the dots icon in the top right that you’ll see a smaller number.

This is because we added a rolling upload-date to the initial search to return the most interesting photos in the last month or so, rather than always have the same (all-time) photos show up forever, possibly reinforcing their interestingness.

Anyway, not bad really.

Posted in geo

Living In the Donut Hole

video by origami madness

A long long time ago (2005) in a galaxy far far way (Vancouver) when we joined Yahoo! and moved FlickrHQ to the Bay Area all but one or two members of the team lived within ten square blocks of each other in San Francisco’s Mission District.

John Allspaw, a long-time resident of the Mission used to regale us with stories of one of the neighbourhood’s notable quirks commonly referred to as the “donut hole”: The rest of the city could be covered in fog, or raining, but the moment you crossed over in the Mission the sky would open up and the entire neighbourhood would be bathed in sunshine.

When John and George Oates and I used to car pool between the city and the offices in Sunnyvale, we would drive up and down highway 280 and sure enough as you approached the city, at the end of the day, you would drive into an enormous blanket of fog the moment we passed the airport in Millbrae. And as soon as we’d pulled off the San Jose exit there would be an open stretch of clear sky all the way to Civic Center where it would stop again just as suddenly.

Some mornings, when I look out my kitchen window at the clouds hanging over Diamond Heights I like to pretend I can see the curvature of the inside of the donut hole itself. I was reminded of all this the other morning when I was generating some visualizations based on the shapefiles that are derived from the almost 100 million geotagged photos on Flickr.

Paris (Ile-de-France)

The larger, blue, contour is the “shape” of the city of Paris (or WOE ID 615702) according to Flickr. The smaller white contours are the child neighbourhoods of that WOE ID with public, geotagged photos. So, what’s going on then?

The first outline maps roughly to the extremities of the RER, the communter train that services Paris and the surrounding suburbs. This is a fairly accurate representation of the “greater metropolitain” area of Paris. Metropolitain areas, increasingly common in both popular folklore and government administrivia as more and more people shift from rural to urban living , are noticeably lacking from the Flickr hierarchy of place types and a subject probably best left for another blog post.

Untitled #1202166719

The rest, taken as a whole, follow closer to the shape of the old city gates that most people think of when asked to imagine Paris. Which one is right? Well, both obviously!

Cities long ago stopped being defined by the walls that surround(ed) them. There is probably no better place in the world to see this than Barcelona which first burst out of its Old City with the construction of the Eixample at the end of the 19th century and then again, after the wars, pushed further out towards the hills and rivers that surround it.

There are lots of reasons to criticize urban sprawl as a phenomenon but sprawl, too, is still made of people who over time inherit, share and shape the history and geography they live in. Whether it’s Paris, Los Angeles, William Gibson’s dystopic “Boston-Atlanta Metropolitain Axis” (BAMA) or the San Francisco “Bay Area” they all encompass wildly different communities who, in spite of the grievances harboured towards one another, often feel as much of a connection to the larger whole as they do to whatever neighbourhood, suburb or village they spend their days and nights in.

ORY

That’s one reason I think it’s so interesting to look at the shape of cities and see how they spill out beyond the boundaries of traditional maps and travel guides. In the example above the shape for Paris completely engulfs the commune of Orly, 20 kilometers to the South of central Paris, which makes a certain amount of sense.

It also contains Orly airport which isn’t that notable except that we treat airports as though they were cities in their own right because the realities of contemporary travel mean that airports have evolved from being simple gateways to captial-P places with their own culture, norms and gravity. So, now you have cities contained within cities which most people would tell you are just neighbourhoods.

We’re recently finished rendering the second batch of shapefiles and looking ahead I am wondering whether we should also be rendering shapes based on the relationship of one place to another. Rendering the shape of the child places for a city or a country (you can do this using the handy, if awkwardly named, flickr.places.getChildrenWithPhotosPublic API method) would allow you to see a city’s “center” but also provide a way to filter out parts of a shape with low Earthiness (aka water).

Americonia

The issue is not to prevent, or correct, shapes that provide a “false” view because I don’t think they do. As Schuyler observed, while we were getting all this stuff to work in the first place, and testing the neighbourhoods that meet San Francisco Bay they are really the shapes of people looking at the city. They are each different, but the same.

But maybe we should also map the neighbourhoods that aren’t considered the immediate children of a city but which overlap its boundaries. What if you could call an API method to return the list or the shape of a place’s “cousins”? What could that tell us about a place?

San Francisco

What does all of this have to do with donuts? Nothing really, but it’s a nice way to think about the problem and since we have a long and storied tradition of silly names for projects I imagine this one will stick too.

There are no fixed dates yet for when, or whether, any of this will make its way in to the API but quite a lot of it could be done with API methods already available today. One change we have made is to add a new flickr.places.getShapeHistory API method which include pointers to all the shapefiles that have been rendered for a place. I have dim and distant memories of possible reasons why not to do this, in the past, but the exercise in making donut shapes makes me think I was wrong. The more data and “nubby bits” that people have to work with the more interesting it will be for everyone.

Enjoy!

The Shape of Alpha

Untitled #1221325485

We have a lot of geotagged photos

Almost ninety million, as I write this, and the numbers keep growing especially as nearly every new smart phone released to market has not only a camera but also the ability to capture location information with it.

For every geotagged photo we store up to six Where On Earth (WOE) IDs. These are unique numeric identifiers that correspond to the hierarchy of places where a photo was taken: the neighbourhood, the town, the county, and so on up to the continent. This process is usually referred to as reverse-geocoding.

Over time this got us wondering: If we plotted all the geotagged photos associated with a particular WOE ID, would we have enough data to generate a mostly accurate contour of that place? Not a perfect representation, perhaps, but something more fine-grained than a bounding box. It turns out we can.

So, starting today there are 150,000 (and counting) WOE IDs with proper (-ish) shape data, available via the Flickr API. What kind of shapes, you ask?

Continents:


Countries:


States and cities:


Even neighbourhoods:


Each one of those illustrations represents the boundaries of a particular place whose outline was generated using nothing but the latitudes and longitudes of the geotagged photos associated with that location’s WOE ID. No GIS information was harmed in the creation of these shapes.

How cool is that?!

How does it work?

The short version is: Scary and complicated maths. The longer version is: We are generating alpha shapes using the set of unique latitudes and longitudes associated with a WOE ID. The long version, to quote Tran Kai Frank Da and Mariette Yvinec, is:

“Imagine a huge mass of ice-cream making up the space … and containing the points as hard chocolate pieces. Using one of those sphere-formed ice-cream spoons we carve out all parts of the ice-cream block we can reach without bumping into chocolate pieces, thereby even carving out holes in the inside (eg. parts not reachable by simply moving the spoon from the outside). We will eventually end up with a (not necessarily convex) object bounded by caps, arcs and points. If we now straighten all round faces to triangles and line segments, we have an intuitive description of what is called the alpha shape…”

(There are also some useful illustrations of what that all means on Francois Belair’s Everything You Always Wanted to Know About Alpha Shapes But Were Afraid to Ask website.)

The community of authority and the authority of community

This is the important part: Many, if not most, of these shapes will look a little weird. Possibly even “wrong”. This is both okay and to be expected for a few reasons, at least.

  • Sometimes we just don’t have enough geotagged photos in a spot to make it is possible to create a shapefile. Even if we do have enough points to create a shape there aren’t enough to create a shape that you’d recognize as the place where you live. We chose to publish those shapes anyway because it shows both what we know and don’t about a place and to encourage users to help us fix mistakes.

    If the shape of the neighbourhood is incomplete or looks weird why not consider organizing a photowalk around its edges and when you get home add them to the map. The next time we generate a new shapefile for that neighbourhood it should look more like the place you recognize!

  • We did a bad job reverse geocoding photos for a particular spot and they’ve ended up associated with the wrong place. We’ve learned quite a lot about how to do a better job of it in the last two years but there is a limit to how much human awareness and subtlety we can codify. Sometimes, the data we have to try and work out what’s going on is just bad or out of date.

    Ultimately, that’s why we added the tools to help users correct their geotagged photos so that we can adjust things to their understanding of the world and begin to map facts on the ground rather than from on high.

  • We are not very sophisticated yet in how we assign the size of the alpha variable when we generate shapes. As far as we can tell no one else has done this sort of thing so like reverse-geocoding we are learning as we go. For example, with the exception of continents and countries we boil all other places down to a single contiguous shape. We do this by slowly cranking up the size of the ice cream scoop which in turn can lead to a loss of fidelity.

    Does the shape of Florida, or of Italy, include the waters that lie between the mainland and the surrounding islands? It’s not usually the way we imagine the territory that a place occupies but I think it probably does. On the other hand, including the ocean between California and Hawaii as part of the United States would be kind of dumb.

  • Are any of these the correct decisions? We’re not sure yet.

A concrete example to illustrate the point. Here are two versions of the island of Montreal, each generated from the same set of coordinates. The version on the left used an alpha number (an ice cream spoon) large enough to ensure that only a single shape was created compared with the version on the right that allowed for two shapes.


What’s going on, then? All those photos taken in St. Jean-sur-Richelieu (20 minutes south of Montreal) were added to the map back when we first added geotagging to the site and the information about the province of Quebec was not as detailed as what we have now. Ultimately, we decided to include the version on the left because as Matt Jones recently said:

The long here that Flickr represents back to me is becoming only more fascinating and precious as geolocation starts to help me understand how I identify and relate to place. The fact that Flickr’s mapping is now starting to relate location to me the best it can in human place terms is fascinating – they do a great job, but where it falls down it falls down gracefully, inviting corrections and perhaps starting conversation.”

As with any visualization of aggregate data there are likely to be areas of contention. One of the reasons we’re excited to make this stuff available is that much of it simply isn’t available anywhere else and the users and the developer community who make up Flickr have a gift for building magic on top of the API so we’re doubly-excited to see what people do with it.

That said please remember that this it is an aggregate view of things and should be treated more like the the zeitgeist of a place and not as capital-C confirmed facts on the ground or our taking sides in any conflicts (real, imagined or otherwise) between friends and neighbours.

These are not maps you should use to guide your spaceship back to Earth but they’re probably good enough to explore the possibilities.

Clustr

UR DOTZ I HAS DEM

Meanwhile, back in the nuts-and-bolts department: The actual alpha shapes are generated by a program called Clustr, written for us by the fantabulous Schuyler Erle.

Clustr is a command-line application written in C++ that takes as its arguments the path to a file containing a list of points (the hard chocolate pieces) and an alpha parameter (the ice cream spoon) and generates a shapefile describing the contour (the alpha shape) of that list. Anecdotally, we’ve seen Clustr plow through a file with four million unique coordinates (representing the continental United States, Alaska and Hawaii) in under three minutes on some pretty modest hardware.

The shapedata for a WOE ID is available via the Flickr API using the flickr.places.getInfo method.

Not all places have shape data yet so the root <place> element contains a has_shapedata attribute for checking at a glance. Otherwise you can test for the presence of a <shapedata> element. It will look like this:

<place place_id="4hLQygSaBJ92" woeid="3534"
	latitude="45.512" longitude="-73.554"
	place_url="/Canada/Quebec/Montreal" place_type="locality"
	name="Montreal, Quebec, Canada"
	has_shapedata="1">
	
   <!-- all the usual places hierarchy elements -->

   <shapedata created="1223513357" alpha="0.012359619140625"
      count_points="34778" count_edges="52">
      <polylines>
         <polyline>
            45.427627563477,-73.589645385742 45.428966522217,-73.587898254395, etc...
         </polyline>
      </polylines>
   </shapedata>

</place>	

Sometime next week, we will also include links to a real live ESRI shapefile, the well-known and mostly-loved lingua franca of the GIS community, for each WOE ID. They were supposed to be included with this release but because of a last minute glitch they need to be prettied up a little first. We think that the inclusion of the polylines will be enough to keep people busy until then. Shapefiles will be included, in the API, as a link to a compressed file you can download separately. For example:

Update: The first round of (ESRI) shapefiles have been reprocessed and are now available via the API. Shapefiles are included as a link to a compressed file you can download separately. For example:

    <urls>
       <shapefile>
          http://farm4.static.flickr.com/9999/shapefiles/3534_20081020_S33KR3TSHAPE.tar.gz
       </shapefile>
    </urls>

Our plan is to generate new renderings on a relatively constant basis, something like every month or two, though we haven’t firmed up any of those details yet. We’ll post about them here or on the API mailing list as things are worked out.

But wait, there’s more!

Along with the shape data the source code for Clustr is available in the Flickr Code repository and through our trac install, distributed under the GPL (version 2).

Clustr has two major dependencies not included with the source that you will need to install yourself in order to use. They are the Computational Geometry Algorithms Library (CGAL) and the Geospatial Data Abstraction Library (GDAL). Both are relatively straightforward to install on Linux and BSD flavoured operating systems; Windows and OS X are still a bit of a chore.

You probably won’t be able to download Clustr and simply plug it in to your awesome web-application today but I am hopeful that in time the community will develop higher level language (Perl, Python, Ruby, you name it…) bindings to make it easier and faster to write tools that build on the work we’ve done so far.

photo by Julian Bleecker

By the way, there is a still a known-known bug in Clustr rendering interior rings (the donut holes where there are no geotagged photos) in shapefiles. Specifically, they holes are rendered as actual polyline records. You can see an example of the problem in the screenshot of the shapefile for North America, above. We hope to have a proper patch in place by the time we make the ESRI files available next week. As it is since the problem only manifests itself for countries and continents it seemed like a reasonable thing for a version 0.1 release.

Update: Clustr 0.2, with a fix for errant interior rings, has been checked in to the code.flickr.com SVN repository.

Finally, these are early days and this is very much a developer’s release so we look forward to your feedback and also hope you will be understanding as we learn our way around the gotchas and quirks that will no doubt pop up.

In other geostuffs

In other geostuffs, we have enabled Open Street Maps tiles for two more cities: Baghdad and Kabul and George has written a fantastic post highlighting some of the photos we’ve found in both cities so go and have a look.

Picture 16

Map data CCBYSA 2008 OpenStreetMap.org contributors

Enjoy!

Who’s On First?

Untitled World View #1215585993

Normally we don’t talk about upcoming features but in recent weeks we’ve been hard-pressed to keep a lid on our renewed excitement for kittens. We’re betting 2009 will be a big year for kittens and it is why Dan and Heather are taking so much time to hash out the details for the new flickr.kittens API framework which we’re confident will re-embiggen-ize the how, the what and the why of photo-sharing!

To pass the time, until then, I’m going to talk about some of the geo-related API methods that have been released in the last few months, but perhaps not properly explained in detail and introduce a new minty-fresh method which hasn’t been discussed at all!

Cake for breakfast

First, the new stuff.

Places for a user

We’ve added a new authenticated method to the flickr.places namespace called flickr.places.placesForUser which returns the top 100 unique places, scoped by place type, where a user has geotagged photos. For example, I’ve geotagged photos in the following countries:

# ?method=flickr.places.placesForUser&place_type=country

<places total="7">
	<place place_id="4KO02SibApitvSBieQ" woeid="23424977"
		latitude="48.890" longitude="-116.982"
		place_url="/United+States" place_type="country"
		photo_count="1264">United States</place>
	<place place_id="EESRy8qbApgaeIkbsA" woeid="23424775"
		latitude="62.358" longitude="-96.582"
		place_url="/Canada" place_type="country"
		photo_count="307">Canada</place>

	<place place_id="3s63vaibApjQipWazQ" woeid="23424950"
		latitude="39.895" longitude="-2.988"
		place_url="/Spain" place_type="country"
		photo_count="67">Spain</place>
	<place place_id="6immEPubAphfvM5R0g" woeid="23424819"
		latitude="46.712" longitude="1.718"
		place_url="/France" place_type="country"
		photo_count="60">France</place>
	<place place_id="DevLebebApj4RVbtaQ" woeid="23424975"
		latitude="54.313" longitude="-2.232"
		place_url="/United+Kingdom" place_type="country"
		photo_count="34">United Kingdom</place>
	<place place_id="mSCQNWWbAphdLH6WDQ" woeid="23424812"
		latitude="64.950" longitude="26.064"
		place_url="/Finland" place_type="country"
		photo_count="24">Finland</place>

	<place place_id="mpa01jWbAphICsyCsA" woeid="23424853"
		latitude="42.502" longitude="12.573"
		place_url="/Italy" place_type="country"
		photo_count="8">Italy</place>
</places>

The response format is (almost) like all the other places methods, which I guess makes it a standard places response though we haven’t gotten around to standardizing it like we have with photos. Places responses will always contain a “place ID” and a “WOE ID”, a “latitude” and a “longitude”, a “place type” and a “place URL” attribute. They usually contain an “accuracy” attribute but it doesn’t make any sense in the a list of places for a user since the photos, clustered by place type, may have been geotagged at multiple zoom levels. In this example, we’ve also added a “photo count” attribute since that’s an interesting bit of information.

The list of place types with which to scope a query by is limited to a subset of the place types in the Flickr location hierarchy, specifically: neighbourhoods, localities (cities or towns), regions (states) and countries. While place_type is a required argument for the method, there are two other optional parameters you can use to filter your results.

Places for a user (and a place)

The first is woe_id and ensures that places of a given type also have a relationship with that WOE ID. For example, these are all the localities for my geotagged photos taken in Canada (WOE ID 23424775):

# ?method=flickr.places.placesForUser&place_type=locality&woe_id=23424775

<places total="5">
	<place place_id="4hLQygSaBJ92" woeid="3534"
		latitude="45.512" longitude="-73.554"
		place_url="/Canada/Quebec/Montreal" place_type="locality"
		photo_count="221">Montreal, Quebec</place>
	<place place_id="63v7zaqQCZxX" woeid="9807"
		latitude="49.260" longitude="-123.113"
		place_url="/Canada/British+Columbia/Vancouver" place_type="locality"
		photo_count="59">Vancouver, British Columbia</place>
	<place place_id="zrCws.mQCZj_" woeid="9848"
		latitude="48.428" longitude="-123.364"
		place_url="/Canada/British+Columbia/Victoria" place_type="locality"
		photo_count="9">Victoria, British Columbia</place>

	<place place_id="WzwcDQCdAJsL" woeid="4177"
		latitude="44.646" longitude="-63.573"
		place_url="/Canada/Nova+Scotia/Halifax" place_type="locality"
		photo_count="3">Halifax, Nova Scotia</place>
	<place place_id="XlQb2xedAJvr" woeid="4176"
		latitude="44.673" longitude="-63.575"
		place_url="/Canada/Nova+Scotia/Dartmouth" place_type="locality"
		photo_count="1">Dartmouth, Nova Scotia</place>
</places>

(Most) places for a user (and a place)

The second optional parameter is threshold which requires a place have a minimum number of photos associated with it in order to be included in the result set. Any place that falls below the threshold will be rolled-up in to its parent location. For example, if we search for localities in Canada but also a minimum threshold of 5 photos per location the towns of Halifax and Dartmouth are rolled up in to the province of Nova Scotia:

# ?method=flickr.places.placesForUser&place_type=locality&woe_id=23424775&threshold=5

<places total="4">
	<place place_id="4hLQygSaBJ92" woeid="3534"
		latitude="45.512" longitude="-73.554"
		place_url="/Canada/Quebec/Montreal" place_type="locality"
		photo_count="221">Montreal, Quebec</place>

	<place place_id="63v7zaqQCZxX" woeid="9807"
		latitude="49.260" longitude="-123.113"
		place_url="/Canada/British+Columbia/Vancouver" place_type="locality"
		photo_count="59">Vancouver, British Columbia</place>
	<place place_id="zrCws.mQCZj_" woeid="9848"
		latitude="48.428" longitude="-123.364"
		place_url="/Canada/British+Columbia/Victoria" place_type="locality"
		photo_count="9">Victoria, British Columbia</place>
	<place place_id="QpsBIhybAphCEFAm" woeid="2344921"
		latitude="44.727" longitude="-63.587"
		place_url="/Canada/Nova+Scotia" place_type="region"
		photo_count="4">Nova Scotia, CA</place>
</places>

Note that we only roll up a single level so if, like the Halifax and Dartmouth, a locality gets rolled up in to its parent region it may still have fewer photos associated with it than the threshold you passed with the method call. If you think this is crazy talk and/or have some other use case we haven’t considered with this model tell us why and we can revisit the decision.

Untitled Relationship #1219894402

Finally, as mentioned above the flickr.places.placesForUser method requires that you include an auth token with minimum read permissions. As always, please take extra care to respect people’s senstitivies when it comes to location data and, above all, don’t be creepy.

Meanwhile, back at the Ranch

About a week ago, I was asked whether it was possible to use the Flickr API to get a feed of geotagged photos (for a particular place/radius) sorted by interestingness, filtered by CC license to which I quickly replied: WOE IDs, the flickr.places APIs and the “radius” parameter in the flickr.photos.search method should get you what you need! (Also the API responses as syndication feeds support, if you’re being finnicky about the question.)

Which got me thinking that while we’ve told people about WOE IDs and the Places API we haven’t really made a lot of noise about the addition of radial queries and the has_geo flag to the flickr.photos.search method. We’ve mentioned it in passing, here and there, but never really tied it all together. So, let’s start with WOE IDs:

WOE (short for Where On Earth) IDs are the unique identifiers in the giant database of places that we (and FireEagle and the rest of Yahoo!) use to keep track of where stuff is. They are also available to you and the rest of the Internets via the public GeoPlanet API. In Flickr, every geotagged photo has up to (6) associated WOE IDs representing a neighbourhood, locality, county (if present), region, country and continent.

Geocoding

Using the example above, you could start with an API call to the flickr.places.find method which is like an extra-magic geocoder: It not only resolves places names to latitude and longitude coordinates but also returns the WOE ID for the place that contains it. Searching for “San Francisco CA” returns WOE ID 2487956 which you can use to call the flickr.photos.search method asking for all the photos geotagged in the city of San Francisco sorted by interestingness with a Creative Commons Attribution license. Something like this:

# ?method=flickr.places.find&query=San+Francisco+CA

<places query="San Francisco CA" total="1">
	<place place_id="kH8dLOubBZRvX_YZ" woeid="2487956" latitude="37.779"
       	longitude="-122.420" place_url="/United+States/California/San+Francisco"
       	place_type="locality">San Francisco, California, United States</place>
</places>

# ?method=flickr.photos.search&license=4&sort=interestingness-desc 
# 	&woe_id=2487956&extras=tags,geo,license


<photos page="1" pages="289" perpage="100" total="28809">
	<photo id="145874931" owner="37996593020@N01" secret="b695138626" server="52"
       	farm="1" title="bridge" ispublic="1" isfriend="0" isfamily="0"
       	tags="sanfrancisco bridge water night reflections geotagged lights
       	baybridge geolat3779274 geolon12239096 sfchronicle96hours
       	sanfranciscochronicle96hours" latitude="37.79274" longitude="-122.39096"
       	accuracy="16" license="4"
		place_id="kH8dLOubBZRvX_YZ" woeid="2487956"/>

	<!-- and so on -->
</photos>

Reverse geocoding

You can also lookup the WOE ID for any set of latitude and longitude coordinates. Imagine that you are standing in front the infamous Wall of Rant in San Francisco’s Mission district and you’d like to see photos for the rest of the neighbourhood.

Picture 1

If you know your geo coordinates you can call the flickr.places.findByLatLon method to reverse geocode a point to its nearest WOE ID which can then be used to call the trusty flickr.photos.search method. Like this (without the photos.search part since it’s basically the same as above):

# ?method=flickr.places.findByLatLon&lat=37.752969&lon=-122.420844

<places latitude="37.752969" longitude="-122.420844" accuracy="16" total="1">
	<place place_id="C.JdRBObBZkMAKSJ" woeid="2452334"
	    latitude="37.759" longitude="-122.418"
	    place_url="/United+States/California/San+Francisco/Mission"
	    place_type="neighbourhood"/>
</places>

Nearby

But what if you just want to see photos nearby a point? Radial queries, recently added to the photos.search method, allow you to pass lat and lon parameters and ask Flickr to “show me all the photos within an (n) km radius of a point”. You have always been able to do something like this using the bbox parameter but radial queries differ in two ways:

  1. They also save you from having to calculate a bounding box which is, you know, boring.
  2. Results are sorted by distance from the center point (you can override this by setting the sort parameter). Trying to do the same with a bounding box query would mean fetching all the results first and then sorting them which both expensive and boring and breaks the pagination model.

Radial queries are not meant for pulling all the photos at the country or even state level and as such the maximum allowable radius is 32 kilometers (or 20 miles). The default value is 5 and you can toggle between metric and imperial by assigning the radius_units parameter a value of “km” or “mi” (the default is “km”).

# ?method=flickr.photos.search&lat=37.752969&lon=-122.420844 
# 	&radius=1&extras=geo,tags&min_taken_date=2008-09-01+00%3A00%3A00


<photos page="1" pages="1" perpage="100" total="9">
	<photo id="2820548158" owner="29072902@N00" secret="b2fc694880" server="3288"
		farm="4" title="20080901130811" ispublic="1" isfriend="0" isfamily="0"
		latitude="37.751166" longitude="-122.418833" accuracy="16"
		place_id="C.JdRBObBZkMAKSJ" woeid="2452334"
		tags="moblog shinobu"/>

	<!-- and so on -->
</photos>

See that min_taken_date parameter? Like all geo-related query hooks in the flickr.photos.search method you need to pass some sort of limiting agent: a tag, a user ID, a date range, etc. If you insist on passing a pure geo query we will automagically assign a limiting agent of photos taken within the last 12 hours.

(I can) has geo

Finally (no, really) if you just want to keep things simple and use a tag search you can also call the flickr.photos.search method with the has_geo argument which will scope your query to only those photos which have been geotagged. For example, searching for all geotagged photos of kittens taken in tokyo:

# ?method=flickr.photos.search&tags=tokyo,kitten&tag_mode=all 
# 	&has_geo=1&extras=tags,geo

<photos page="1" pages="1" perpage="100" total="60">
	<photo id="2619847035" owner="27921677@N00" secret="0979aed596" server="3011"
       		farm="4" title="Kittens in Akiba" ispublic="1" isfriend="0" isfamily="0"
       		tags="japan cat tokyo kitten crowd akihabara unexpected"
		latitude="35.698263" longitude="139.771977" accuracy="16"
		place_id="aod14iaYAJ1rDE.R" woeid="1118370"/>

	<!-- and so on -->

</photos>

Maps are purrrr-ty

Which is a nice segueway in to telling you that on Tuesday we turned on the map-love for
the city of Tokyo, in addition to Beijing and Black Rock City (aka Burning Man), using the Creative Commons licensed tiles produced by the good people at Open Street Maps. We’re pretty excited about this but rather than just showing another before and after screenshot we decided that the best way to showcase the new tiles was with… well, kittens of course!

Picture 1

Sophie’s Choice by tenaciousme

Enjoy!

That’s a lot to digest in one go but we promise there won’t be a pop quiz on Monday. Hopefully there’s something useful for you in the twisty maze of possibilities, now or in an oh yeah, what about… moment in the future, and maybe even the seed for a brand new API application. Kittens!

Flickr [heart] Burning Man [heart] OpenStreetMap

[new map tiles]

Everybody loves Burning Man!

Well I don’t, but then I’m grumpy like that. Anyway, imagine my excitement waking up this morning knowing that Burning Man 2008 had just started. Here’s where the photos will start appearing as people get re-hydrated and find an internet connection …

Your maps not on OSM

Imagine my excitement even more when I saw on Mikel’s blog that OpenStreetMap (OSM) had pushed new map data (and tiles) out the door for this years burning man, see Burning Man Earth Information Release for no more information what-so-ever ;) Hopefully Mikel will update soon with all the work that went into it.

A quick tile shuffle later, like what we did for Beijing, and we once more have OSM live in Flickr …

Your maps on OSM

So when all those burners come back, it should be easily for them (you know, relatively) to drop those photos onto the map. Why not go see the new map for yourself, it’s rather pretty.

George summed it up well when she said

“That’s part of what appealed to us so much about a fantastic project called OpenStreetMap – a free, editable map of the world, made by the people in it. What an exciting prospect to be able to see maps that are alive and have been lovingly created by citizen cartographers all over the world.”

It’s the power of The Creative Commons (and even more importantly, people) that make stuff like this work, and obviously we’re hoping to continue to do more. The glib answer I give for why this this sort of thing is important is so I can say “If you’re upset that we don’t have map coverage for where you are, you can grab some friends, go out, and make some”.

As sort-of true as that is, probably a better answer is to read Mikel’s posts on Mapping the West Bank and Ups and Downs Mapping the West Bank (once his server recovers from whatever is hitting it, not us!). Which will hopefully illustrate far better than Burning Man why user created mapping data that can be used by anyone willing to use the CC Attribution-Share Alike license, is important.