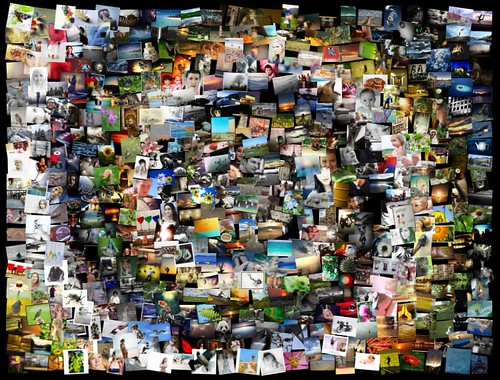
We have a lot of geotagged photos
Almost ninety million, as I write this, and the numbers keep growing especially as nearly every new smart
phone released to market has not only a camera but also the ability to capture location information with it.
For every geotagged photo we store up to six Where On Earth (WOE) IDs. These are unique numeric identifiers that correspond to the hierarchy of places where a photo was taken: the neighbourhood, the town, the county, and so on up to the continent. This process is usually referred to as reverse-geocoding.
Over time this got us wondering: If we plotted all the geotagged photos associated with a particular WOE ID, would we have enough data to generate a mostly accurate contour of that place? Not a perfect representation, perhaps, but something more fine-grained than a bounding box. It turns out we can.
So, starting today there are 150,000 (and counting) WOE IDs with proper (-ish) shape data, available via the Flickr API. What kind of shapes, you ask?
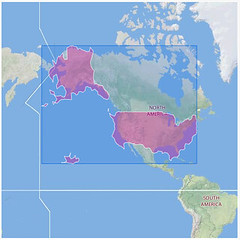
Continents:
 |
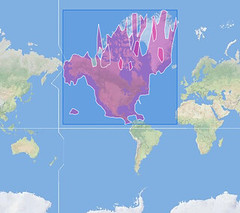 |
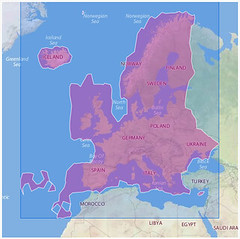
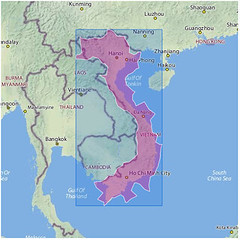
Countries:
 |
 |
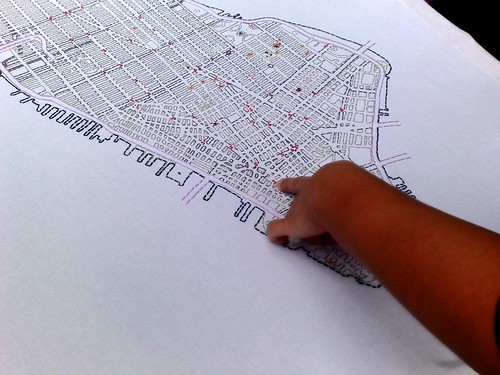
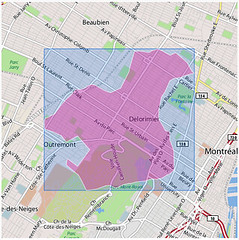
States and cities:
 |
 |
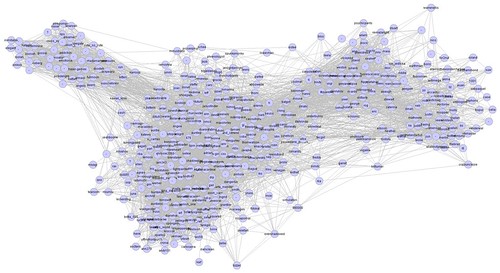
Even neighbourhoods:
 |
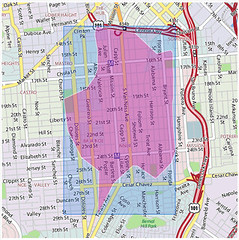 |
Each one of those illustrations represents the boundaries of a particular place whose outline was generated using nothing but the latitudes and longitudes of the geotagged photos associated with that location’s WOE ID. No GIS information was harmed in the creation of these shapes.
How cool is that?!
How does it work?
The short version is: Scary and complicated maths. The longer version is: We are generating alpha shapes using the set of unique latitudes and longitudes associated with a WOE ID. The long version, to quote Tran Kai Frank Da and Mariette Yvinec, is:
“Imagine a huge mass of ice-cream making up the space … and containing the points as
hardchocolate pieces. Using one of those sphere-formed ice-cream spoons we carve out all parts of the ice-cream block we can reach without bumping into chocolate pieces, thereby even carving out holes in the inside (eg. parts not reachable by simply moving the spoon from the outside). We will eventually end up with a (not necessarily convex) object bounded by caps, arcs and points. If we now straighten allroundfaces to triangles and line segments, we have an intuitive description of what is called the alpha shape…”
(There are also some useful illustrations of what that all means on Francois Belair’s Everything You Always Wanted to Know About Alpha Shapes But Were Afraid to Ask website.)
The community of authority and the authority of community
This is the important part: Many, if not most, of these shapes will look a little weird. Possibly even “wrong”. This is both okay and to be expected for a few reasons, at least.
-
Sometimes we just don’t have enough geotagged photos in a spot to make it is possible to create a shapefile. Even if we do have enough points to create a shape there aren’t enough to create a shape that you’d recognize as the place where you live. We chose to publish those shapes anyway because it shows both what we know and don’t about a place and to encourage users to help us fix mistakes.
If the shape of the neighbourhood is incomplete or looks weird why not consider organizing a photowalk around its edges and when you get home add them to the map. The next time we generate a new shapefile for that neighbourhood it should look more like the place you recognize!
-
We did a bad job reverse geocoding photos for a particular spot and they’ve ended up associated with the wrong place. We’ve learned quite a lot about how to do a better job of it in the last two years but there is a limit to how much human awareness and subtlety we can codify. Sometimes, the data we have to try and work out what’s going on is just bad or out of date.
Ultimately, that’s why we added the tools to help users correct their geotagged photos so that we can adjust things to their understanding of the world and begin to map facts on the ground rather than from on high.
-
We are not very sophisticated yet in how we assign the size of the alpha variable when we generate shapes. As far as we can tell no one else has done this sort of thing so like reverse-geocoding we are learning as we go. For example, with the exception of continents and countries we boil all other places down to a single contiguous shape. We do this by slowly cranking up the size of the ice cream scoop which in turn can lead to a loss of fidelity.
Does the
shape
of Florida, or of Italy, include the waters that lie between the mainland and the surrounding islands? It’s not usually the way we imagine the territory that a place occupies but I think it probably does. On the other hand, including the ocean between California and Hawaii aspart of
the United States would be kind of dumb.
Are any of these the correct decisions? We’re not sure yet.
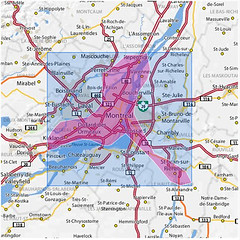
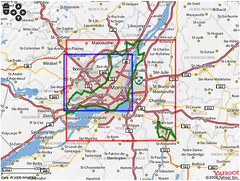
A concrete example to illustrate the point. Here are two versions of the island of Montreal, each generated from the same set of coordinates. The version on the left used an alpha number (an ice cream spoon) large enough to ensure that only a single shape was created compared with the version on the right that allowed for two shapes.
 |
 |
What’s going on, then? All those photos taken in St. Jean-sur-Richelieu (20 minutes south of Montreal) were added to the map back when we first added geotagging to the site and the information about the province of Quebec was not as detailed as what we have now. Ultimately, we decided to include the version on the left because as Matt Jones recently said:
“The long here that Flickr represents back to me is becoming only more fascinating and precious as geolocation starts to help me understand how I identify and relate to place. The fact that Flickr’s mapping is now starting to relate location to me the best it can in human place terms is fascinating – they do a great job, but where it falls down it falls down gracefully, inviting corrections and perhaps starting conversation.”
As with any visualization of aggregate data there are likely to be areas of contention. One of the reasons we’re excited to make this stuff available is that much of it simply isn’t available anywhere else and the users and the developer community who make up Flickr have a gift for building magic on top of the API so we’re doubly-excited to see what people do with it.
That said please remember that this it is an aggregate view of things and should be treated more like the the zeitgeist of a place and not as capital-C confirmed facts on the ground or our taking sides in any conflicts (real, imagined or otherwise) between friends and neighbours.
These are not maps you should use to guide your spaceship back to Earth but they’re probably good enough to explore the possibilities.
Clustr

Meanwhile, back in the nuts-and-bolts department: The actual alpha shapes are generated by a program called Clustr, written for us by the fantabulous Schuyler Erle.
Clustr is a command-line application written in C++ that takes as its arguments the path to a file containing a list of points (the hard chocolate pieces) and an alpha parameter (the ice cream spoon) and generates a shapefile describing the contour (the alpha shape) of that list. Anecdotally, we’ve seen Clustr plow through a file with four million unique coordinates (representing the continental United States, Alaska and Hawaii) in under three minutes on some pretty modest hardware.
The shapedata for a WOE ID is available via the Flickr API using the flickr.places.getInfo method.
Not all places have shape data yet so the root <place> element contains a has_shapedata attribute for checking at a glance. Otherwise you can test for the presence of a <shapedata> element. It will look like this:
<place place_id="4hLQygSaBJ92" woeid="3534"
	latitude="45.512" longitude="-73.554"
	place_url="/Canada/Quebec/Montreal" place_type="locality"
	name="Montreal, Quebec, Canada"
	has_shapedata="1">

   <!-- all the usual places hierarchy elements -->

   <shapedata created="1223513357" alpha="0.012359619140625"
      count_points="34778" count_edges="52">
      <polylines>
         <polyline>
            45.427627563477,-73.589645385742 45.428966522217,-73.587898254395, etc...
         </polyline>
      </polylines>
   </shapedata>

</place>
Sometime next week, we will also include links to a real live ESRI shapefile, the well-known and mostly-loved lingua franca of the GIS community, for each WOE ID. They were supposed to be included with this release but because of a last minute glitch they need to be prettied up a little first. We think that the inclusion of the polylines will be enough to keep people busy until then. Shapefiles will be included, in the API, as a link to a compressed file you can download separately. For example:
Update: The first round of (ESRI) shapefiles have been reprocessed and are now available via the API. Shapefiles are included as a link to a compressed file you can download separately. For example:
    <urls>
       <shapefile>
          http://farm4.static.flickr.com/9999/shapefiles/3534_20081020_S33KR3TSHAPE.tar.gz
       </shapefile>
    </urls>
Our plan is to generate new renderings on a relatively constant basis, something like every month or two, though we haven’t firmed up any of those details yet. We’ll post about them here or on the API mailing list as things are worked out.
But wait, there’s more!
Along with the shape data the source code for Clustr is available in the Flickr Code repository and through our trac install, distributed under the GPL (version 2).
Clustr has two major dependencies not included with the source that you will need to install yourself in order to use. They are the Computational Geometry Algorithms Library (CGAL) and the Geospatial Data Abstraction Library (GDAL). Both are relatively straightforward to install on Linux and BSD flavoured operating systems; Windows and OS X are still a bit of a chore.
You probably won’t be able to download Clustr and simply plug it in to your awesome web-application today but I am hopeful that in time the community will develop higher level language (Perl, Python, Ruby, you name it…) bindings to make it easier and faster to write tools that build on the work we’ve done so far.
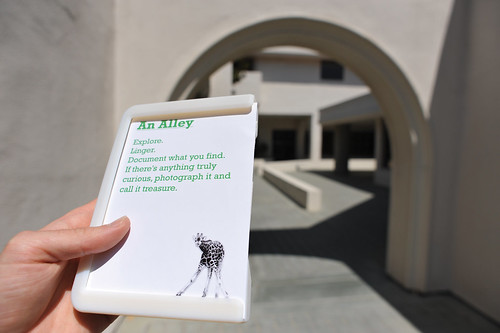
photo by Julian Bleecker
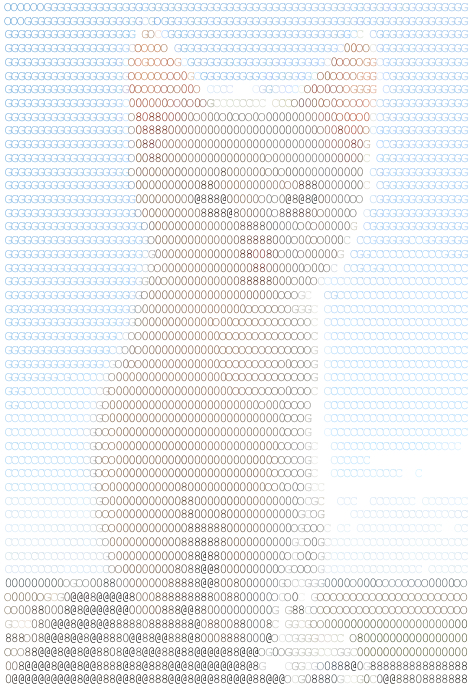
By the way, there is a still a known-known bug in Clustr rendering interior rings
(the donut holes where there are no geotagged photos) in shapefiles. Specifically, they holes are rendered as actual polyline records. You can see an example of the problem in the screenshot of the shapefile for North America, above. We hope to have a proper patch in place by the time we make the ESRI files available next week. As it is since the problem only manifests itself for countries and continents it seemed like a reasonable thing for a version 0.1 release.
Update: Clustr 0.2, with a fix for errant interior rings, has been checked in to the code.flickr.com SVN repository.
Finally, these are early days and this is very much a developer’s release so we look forward to your feedback and also hope you will be understanding as we learn our way around the gotchas and quirks that will no doubt pop up.
In other geostuffs
In other geostuffs, we have enabled Open Street Maps tiles for two more cities: Baghdad and Kabul and George has written a fantastic post highlighting some of the photos we’ve found in both cities so go and have a look.
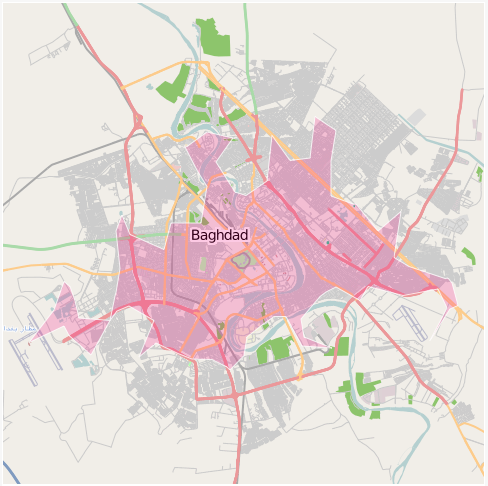
Map data CCBYSA 2008 OpenStreetMap.org contributors
Enjoy!