
A number of people have asked us: where did the pretty graphs from last week’s post come from?
The answer: Ganglia.
It takes a lot of hardware and software to make a site like Flickr run smoothly. The operations team is responsible for scaling up our monitoring platform to collect all of the metrics we need to make informed decisions about where and when to add new hosts and how urgently, understand how different types of hardware perform with similar real life workloads, determine bottlenecks, and more. Flickr uses Ganglia to collect, aggregate, and visualize those metrics.
So, what is Ganglia? Briefly, "Ganglia is a scalable distributed monitoring system for high-performance computing systems such as clusters and grids"* originally developed at the University of California, Berkeley. Ganglia is typically run by administrators of High Performance Clusters, large groups of machines working together to complete tasks. While we have some machines organized into the traditional cluster configuration, for example for log crunching, we simply define a cluster under Ganglia as a group of machines that do similar things but don’t necessarily interact with one another. For example, all of our web servers in each site are one cluster and all caches another. Our databases are broken up into multiple clusters based on functionality. This way, boxes that should be doing the same kind of work can be easily compared against one another.
Once Ganglia is up and running you’ll see a number of system level statistics reported by each node. You can also easily report custom metrics and have them appear on graphs along with the built in metrics. Before the latest release (the 3.1.x line), this meant some code that calls gmetric and entry in the crontab for scheduling execution of that code. Ganglia 3.1 offers an additional facility for injecting custom metrics that easy to use and offers some additional power and flexibility over the gmetric + cron approach.
For more information on how Ganglia works, see the excellent references on the Ganglia Wiki . The community is active and very helpful.
If you’re just getting started with Ganglia, here are some pointers to save you headaches later:
- Don’t use the default multicast address 239.2.11.71 for any clusters. You will start gmond without a config file and it will join that first cluster you defined and you will not be happy that your summary graphs are messy.
- Do put your RRDs on a ramdisk/tmpfs. Your disk(s) will thank you. Don’t forget to setup a job to sync those files to some persistent storage periodically – we do it every 10 minutes.
- Do consider the frequency of data collection and how long you need to keep the data around (and at what resolution). Do you need to know what the 5 minute load average was on your hosts one year ago today (maybe in relation to other metrics)? Do you need to know how many uploads per second those hosts were doing then (certainly)? While individual metric stores can be resized to keep data around for various amounts of time, typically it’s easier to find the least common denominator – the largest amount of time you think you need this information for – and set that in gmetad.conf. The default gmetad config stores data as:
- 15 second average for about an hour
- 6 minute average for about a day
- 42 minute average for about a week
- 2 hour 48 minute average for about a month
- 1 day average for about a year
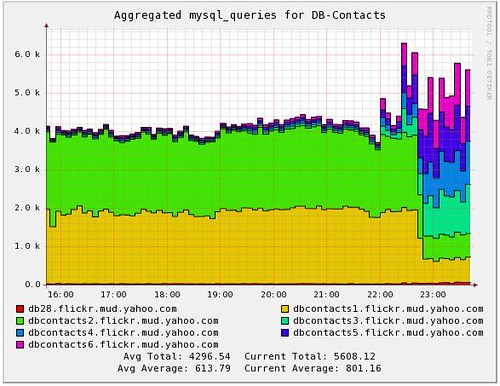
Once you’re up and running with Ganglia you’ll have access to something like the graph from the last post, what we call a stacked graph. Stacked graphs are intended to provide a quick overview of the relative performance of each host in a cluster. The code has been submitted to the Ganglia project for all to use.
Check out http://ganglia.info for more information and stay tuned for more posts about how Flickr uses Ganglia.